
Economics & Growth | Rates | US
Predicting Economic Downturns Using US Treasury Futures

- By Sam van de Schootbrugge
- Sign-up to discuss on Slack
- 5 min read
Economics & Growth | Rates | US
The Treasury market is one of the largest and most liquid markets in the world, making it a good proxy for predicting aggregate economic conditions. Indeed, it is well established that the slope of the yield curve and changes in short-term rates can be leading indicators for the growth rate of real GDP. Now, a Journal of Financial Economics paper examines whether implied volatility in the Treasury futures market has any predictive power over macroeconomic activity. It finds:
Treasury futures derivatives are very liquid financial instruments that instantaneously reflect new forward-looking information regarding the level and volatility of interest rates. According to the authors, implied volatilities from options on Treasury futures are therefore a good proxy for interest rate uncertainty.
Past research has shown that implied volatilities from Treasury markets are positively related to the probability of a recession, changes in the three-month T-bills rate (their proxy for monetary policy), inflation uncertainty, and the probability of deflation.
For this paper, the authors focus specifically on five-year Treasury note futures. It is the largest and most liquid market, and price discovery in the Treasury futures market occurs primarily in this length of contract, rather than in 10-year or long-term Treasury futures.
The authors obtain a time series of option implied volatilities on the five-year note futures in two steps. First, each day they select options with strike prices closest to at-the-money relative to the next closest five-year Treasury note futures contract in the March, June, September, and December cycle. This ensures that options on futures are very close to options on the actual Treasury notes and bonds themselves.
Second, they estimate the implied volatility for the selected options on each day by solving the seminal Black model. They then compute the moneyness-weighted average of the implied volatilities, resulting in a daily time series of option implied volatility on the five-year Treasury note futures contract. They average this time series within each month to obtain a monthly time series from May 1990 through November 2016.
They also calculate YoY growth rates in key macroeconomic variables, such as real GDP, industrial production, personal consumption expenditures, and nonfarm payrolls. These are the dependent variables that the authors want to predict. For controls, they use index returns of Treasury bonds, corporate bonds, and stocks, the CBOE VIX index, credit spreads and the number of housing starts.
First, the authors find that the correlations between yield implied volatilities derived from options on different length Treasury note futures contracts are not high. The only exception is between the five-year and 10-year YIV, the correlation of which is 0.69 and significant at a 1% level.
Next, the authors find five-year, 10-year and long-term YIVs to be negatively correlated with real GDP growth. The strongest contemporaneous correlation (-45% and statistically significant at a 1% level) exists between the five-year YIV and the YoY growth rate of real GDP. Also, over the entire sample period, an increase in the level of the YIV is almost always accompanied by a future decrease in the growth rate of real GDP (Chart 1).
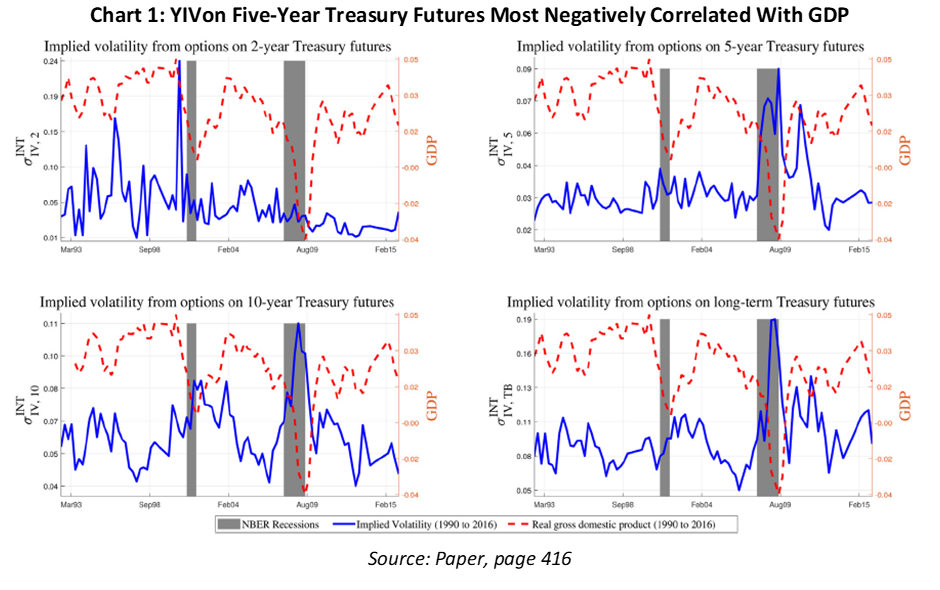
The paper also finds an increase in YIV is associated with lower short-term interest rates, higher returns on Treasury and corporate bonds, higher credit spreads, lower stock market returns, higher stock market volatility, and a decrease in housing starts. And so, the simple correlations indicate YIV increasing during times of economic and financial distress.
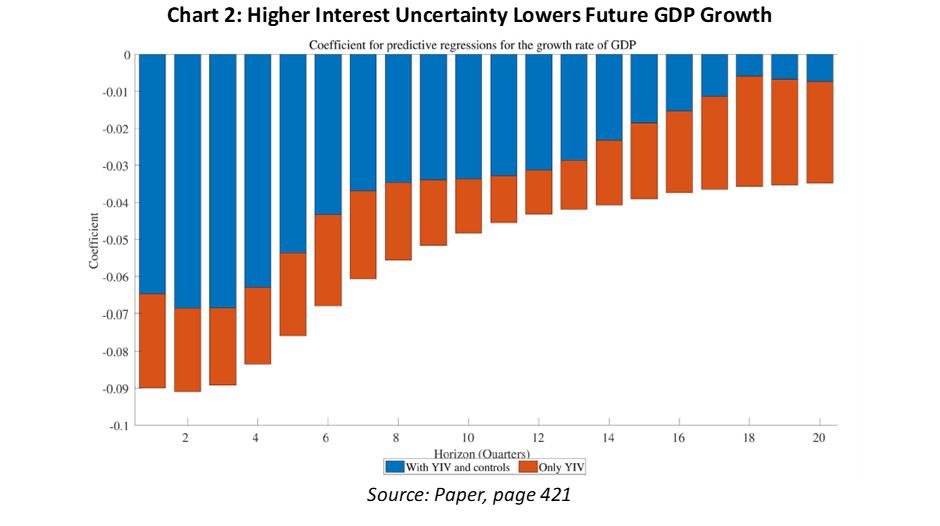
The paper’s main focus is testing whether YIV can predict future growth rates of GDP. Indeed, higher five-year YIV is found to predict lower future GDP growth. Specifically, a one standard deviation increase in the current five-year YIV (equal to 1.17%) is associated with a reduction in annual GDP growth of 1.12% (12 x -0.08 x 1.17%) in the next year. The negative coefficient does not reverse at longer horizons and remains statistically significant up to 36 months ahead (Chart 2).
In addition, the authors find that increases in stock returns, VIX, and housing starts are associated with higher future GDP growth rates, while higher credit spreads forecast lower future GDP growth rates. Also, implied volatility from options on the 10-year and long-term Treasury futures have a statistically significant negative effect on growth over a 12- to 18-month horizon. The coefficients are, however, around half as negative as on the five-year.
In terms of other proxies for macroeconomic activity, a higher five-year YIV is associated with a decline of 2.53%, 1.26% and 1.26% in annual industrial production, consumption and employment growth in the next year, respectively. In fact, interest rate uncertainty accounts for 34% of the variation in the monthly growth rate of industrial production over a one-year horizon.
Volatility is computed as the standard deviation over a rolling 12-month window for the growth rates in the four macroeconomic variables. The forecasting regressions indicate that higher levels of YIV are associated with higher future volatility of the GDP growth rate. Specifically, a one standard deviation increase in YIV sees an increase in the volatility of the GDP growth rate of 0.30% (coefficient of 0.26). Again, the prediction remains significant over a 36-month horizon and peaks after 18 months without controls (Chart 3).
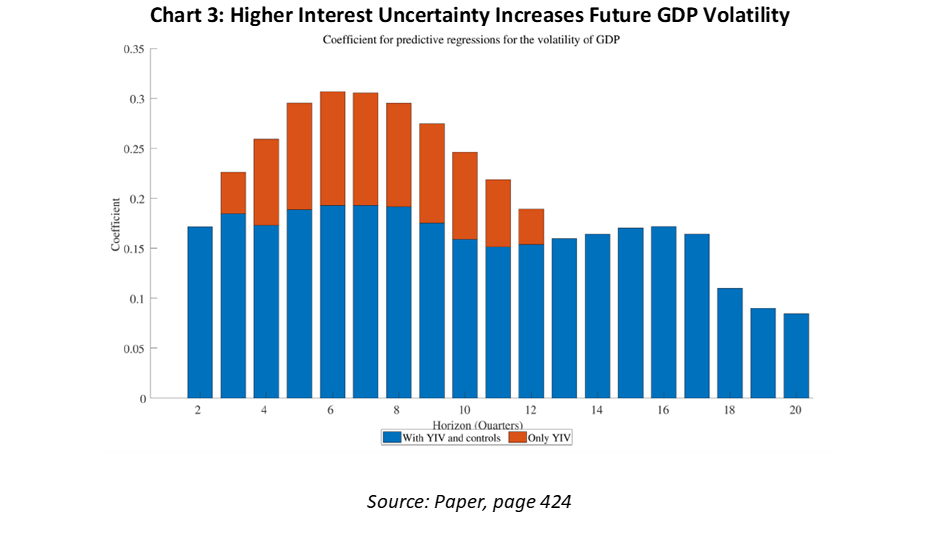
Of all the control variables, only credit spreads and housing starts consistently predict the volatility of the GDP growth rate across all horizons. An increase in credit spreads and a decrease in housing starts predicts higher future volatility of the GDP growth rate. Meanwhile, higher YIV in the 10-year and long-term Treasury futures also predicts higher future volatility of GDP, but not when including the five-year as a control.
Lastly, a one-standard deviation increase in five-year YIV predicts an increase in the volatility of growth rates in industrial production, consumption, and employment by 23%, 17% and 15%, respectively, compared with the sample means (average annualised volatility across the full sample was 4.18%, 2.05% and 1.71%, respectively).
A set of robustness checks leads the authors to conclude that ‘when forecasting the growth rate and volatility of GDP at any horizon, the YIV only model outperforms models with any other single variable or a combination of variables’. That is because it always produces the lowest mean-squared error.
A large existing literature has identified numerous financial variables that help predict future growth rates of macroeconomic variables. Yet few, according to the authors, can forecast both growth rates and volatility. And so, five-year Treasury yield implied volatility, a proxy for interest rate uncertainty, is unique in that it is strongly associated with declining activity and greater future macroeconomic uncertainty. This makes it a useful observable proxy of the likelihood of economic downturns in the next one to five years.
Cremers M., Et Al., (2021), Treasury yield implied volatility and real activity, Journal of Financial Economics, Vol. 140 (2), https://www.sciencedirect.com/science/article/abs/pii/S0304405X20303494?dgcid=rss_sd_all
Spring sale - Prime Membership only £3 for 3 months! Get trade ideas and macro insights now
Your subscription has been successfully canceled.
Discount Applied - Your subscription has now updated with Coupon and from next payment Discount will be applied.