
- With countries reporting cases and deaths in so many different ways, I’ve been looking into better means of comparison.
- Today, I look at how a country’s current daily COVID cases compares to its own history. A reading of 100 would mean it is experiencing its highest ever level, while a reading of 0 means it is at its lowest ever levels.
- On this metric, Argentina, Brazil, Egypt, India, Mexico, Nigeria, Pakistan, Saudi, South Africa, UAE, Singapore, Sweden and Russia are currently at their max or close to max daily cases ever (Chart 1).
- At the other end of the spectrum, China, Iceland, Korea, Austria, Switzerland, Norway, NZ and Czechia are at the low-end of their historic ranges. These countries therefore are most likely to ease restrictions.
- In terms of recent changes in cases and deaths, our peak wave charts show the following:
- In DM, Greece and Finland are in the hot zone, while Sweden appears to be easing. Canada also appears to be falling out of the peak wave zone. Portugal and Belgium have dropped out of the potential second wave quadrant.
- In EM, India and Hungary join Nigeria, Russia and Pakistan in the peak wave zone. South Africa, Singapore, Taiwan and Saudi are in the new wave/peak wave zone.
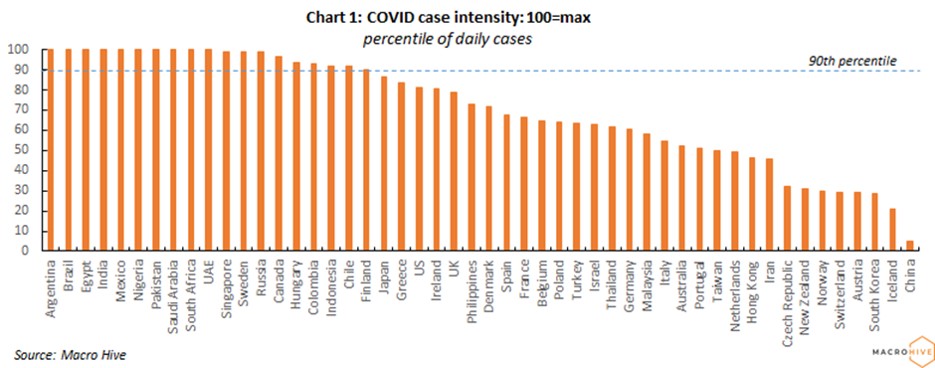
Chart 2: COVID Stages- DM Countries
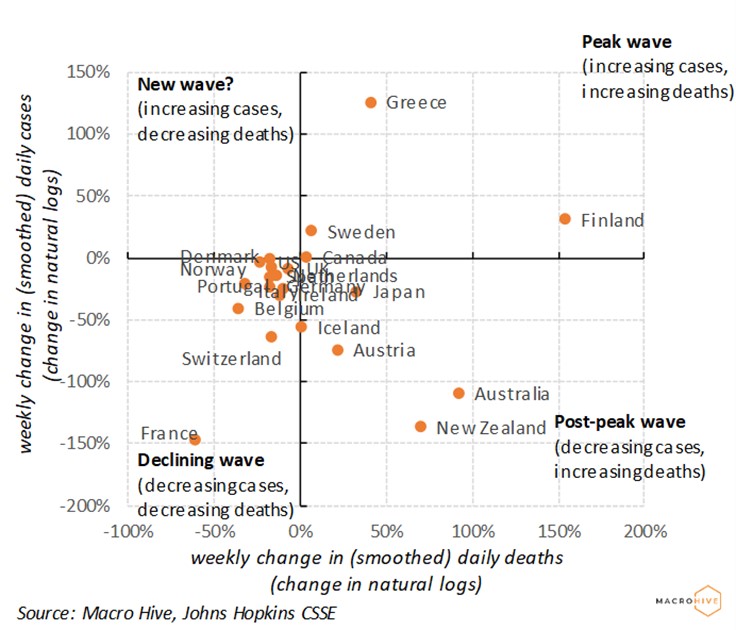
Chart 3: COVID Stages- EM Countries
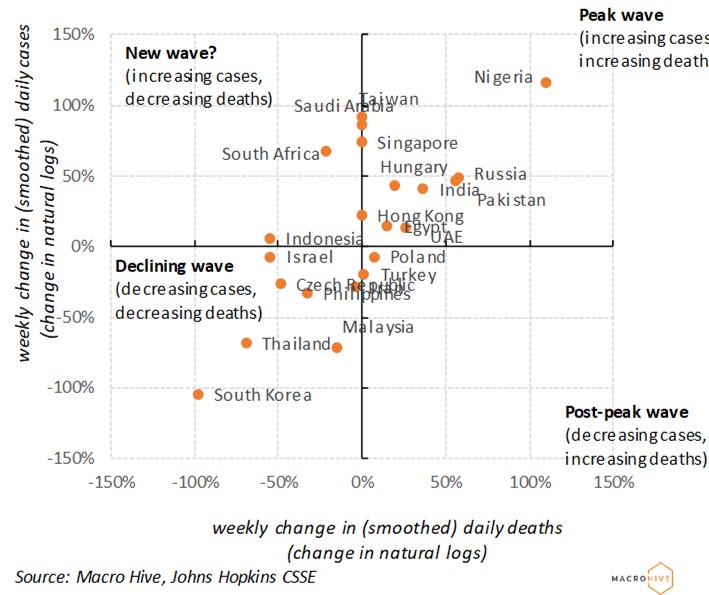
Table 1: Developed Countries: Key COVID-19 Stats
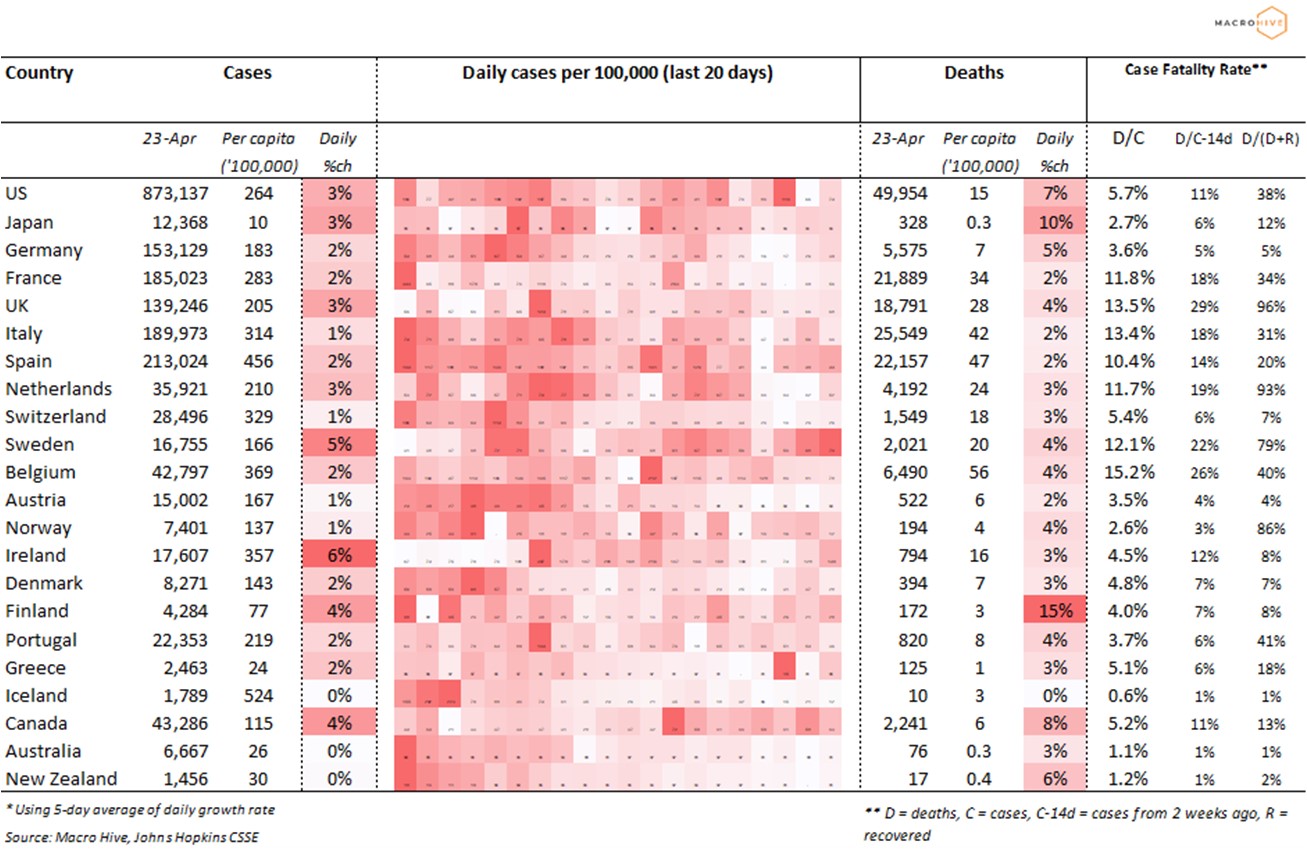
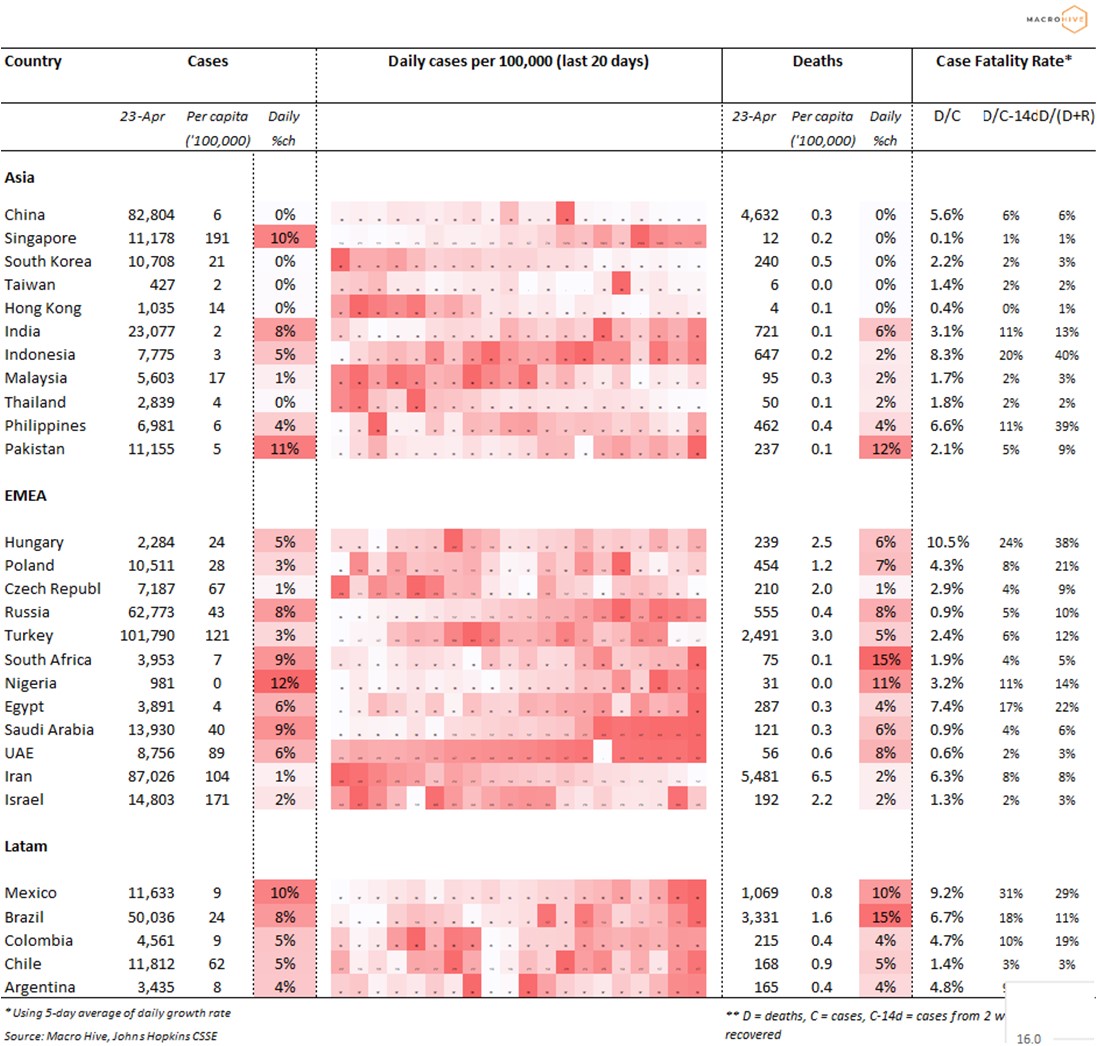
Table 2: Emerging and Newly Industrialised Countries: Key COVID-19 Stats
Bilal Hafeez is the CEO and Editor of Macro Hive. He spent over twenty years doing research at big banks – JPMorgan, Deutsche Bank, and Nomura, where he had various “Global Head” roles and did FX, rates and cross-markets research.

(The commentary contained in the above article does not constitute an offer or a solicitation, or a recommendation to implement or liquidate an investment or to carry out any other transaction. It should not be used as a basis for any investment decision or other decision. Any investment decision should be based on appropriate professional advice specific to your needs.)