
This article is only available to Macro Hive subscribers. Sign-up to receive world-class macro analysis with a daily curated newsletter, podcast, original content from award-winning researchers, cross market strategy, equity insights, trade ideas, crypto flow frameworks, academic paper summaries, explanation and analysis of market-moving events, community investor chat room, and more.
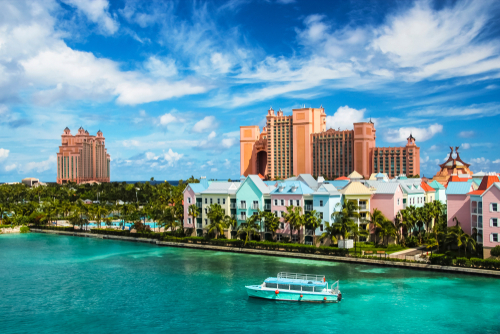
Remember the Fyre Festival debacle? It was a luxury music festival scheduled for April 2017 by Billy McFarland. It was promoted by celebrities like Kendell Jenner, Bella Hadid and Emily Ratajkowski. The festival turned out to be a scam with sandwiches and FEMA disaster tents, rather than gourmet meals and villas. McFarland ended up going to jail. And guess where the festival happened? The Bahamas.
The country has come back into the headlines thanks to the FTX debacle – the company is headquartered in the Bahamas. This is no coincidence. Offshore centres like the Bahamas have less oversight than (say) the US. Indeed, the Bahamas was on the Financial Action Task Force (FATF) list of jurisdictions under increased monitoring up until recently – it had poor anti-money laundering practises.
Growth of Offshore Centres
The trouble is that offshore financial centres have grown significantly over the past decade. Moreover, since around 2012, according to the BIS, the size of the liabilities of non-banks (or shadow banks) has overtaken the size of bank liabilities. This reflects the growth in the shadow financial system, which we have written on before, but also the importance of offshore centres in intermediating these flows. According to the BIS, these centres include:
- British Virgin Islands (BVI)
- Cayman Islands
- Guernsey
- Jersey
- Luxembourg
A broader definition of offshore centres would also include the likes of the Bahamas, Bermuda, Isle of Man, Singapore, Hong Kong and Ireland.
Like with determining the size of collaterised lending, the problem with the financial flows running these centres is that the quality of data reporting is poor. Using External of Wealth of Nations data (EWN), we know that the size of cross-border exposures has grown since 2008 by $12.9 trillion in Luxembourg and Ireland, $6.7 trillion in Singapore and Hong Kong, $3.7 trillion in the Caymans and BVI, and $1.9 trillion in smaller centres like Bermuda, Jersey and the Bahamas. For comparison, they have increased by $3 trillion in Switzerland, while they have been flat in the UK.
Another angle is to look at FDI data. The IMF found that 40% of all global foreign direct investment (FDI) – or $12 trillion – is artificial. That is, they are shell companies used to pass through financial flows with real economic links. Typically, the shell companies are registered in tax havens like the Netherlands, Luxembourg, BVI, Bermuda and the Cayman Islands. The countries that tend to use shell companies the most, as a share of their outbound FDI, are Brazil, Thailand, China, US, UK and India.
Using a similar line of thinking, but for individuals, academic studies have found that private individuals hold around $7 trillion in offshore tax havens. The countries which see their residents do this the most include the UAE, Venezuela, Saudi Arabia, Russia, Argentina and Greece.
Implications
Putting this all together, we find that the shadow financial network has large nodes outside of the typical financial centres of New York and London. Offshore centres like the Caymans, Luxembourg, and BVIs are becoming more important. Moreover, the source the funds running through these centres can be ‘fake’ FDI of multinationals or the private wealth of individuals from autocratic regimes. Given that this is happening in the shadows, it is hard to be precise on the consequences. But we can say that these flows have likely propped up many markets and companies that have poor fundamentals. The Bahamas-based FTX is just the latest example. More are likely to come to the surface.
Our Current Discretionary Trades
Our US rates flattener trade is working well with US 2s10s reaching their lowest levels since the early 1980s. Elsewhere, we exited our short AUD/NZD and short EUR/USD trades and added some bullish China trades. Currently, our trades consist of:
- US rates flattener: sell 2Y, buy 10Y
- Short GBP/CHF: peak UK optimism
- Higher euro yields: short bunds
- EM FX crosses: long THB/TWD, long SGD/CNH
- China bounce: short USD/CLP, long HSI
- EM rates rally: MYR 1s5s flattener
What Are Models Signalling?
We track a range of models which can help understand where the market is in pain:
- Momentum models have performed poorly. Many have started to switch signals – for example on euro (sell to buy). Over the past month, the best performing model has been the DAX momentum model, which is up +4.3% – it is currently giving a ‘buy’ signal.
- Our FX carry models are also underperforming. This suggests carry may struggle into year-end.
Recent Questions from Clients
- Why is bitcoin not falling more?
- Has the dollar peaked?
- How will ESG SFDR reporting rules impact markets?
What I Am Reading and Watching
- We have published the Macro Hive Guide to the football World Cup. I am predicting England will win!
- I was reading Isaac Newton’s diary and this is what I found.
- Thought this note on the EPA vs the grid (US electricity) was interesting.
- We’re getting a better idea of AI’s true carbon footprint
- Highlights of Nassim Taleb’s talk.
- AI computer in the cloud to be available soon.