
Summary
- After more than a decade of relative calm in the banking sector, the Silicon Valley Bank (SVB) crisis was a wake-up call and reminder that bank runs and failures can still happen.
- Over the past few weeks, various news articles have compared SVB with previous banking failures.
- We review the circumstances of major bank and financial institution failures over the past 40 years, starting with Penn Square Bank.
- We find most crises follow a similar pattern. SVB fits that pattern in many ways – but it differs in some key respects, too, making it tricky to estimate how this one plays out.
Market Implications
- The SVB crisis appears to have passed – as these crises typically do.
- But the problems that sunk SVB – underwater bonds and loss of deposits – are widespread.
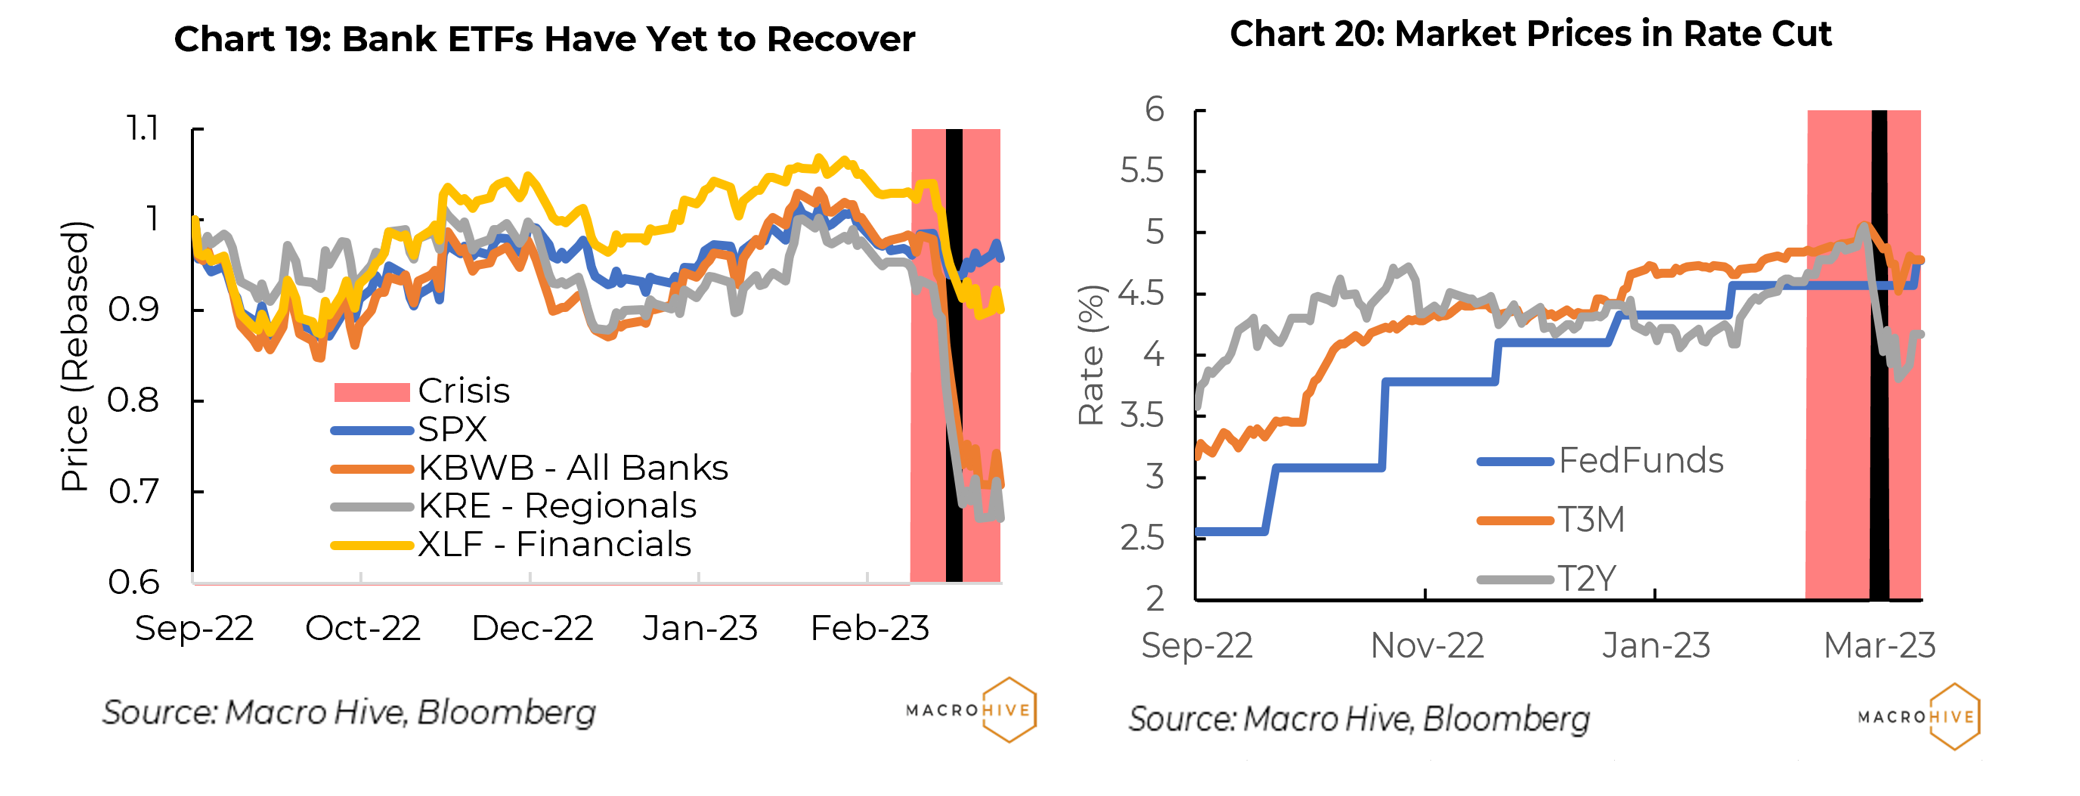
- Regulators have not done anything yet to address this systemic risk. Bank exchange-traded funds (ETFs) say it all – they remain near the lows of the crisis, strongly suggesting that this crisis has further to run.
US Banking Crises: Where to Begin…
We review the circumstances behind notable bank and financial institution failures over the past 40 years. We focus particularly on how equity and bond markets responded. We have cherry-picked these situations either because they have been mentioned in recent weeks as US and European banking systems have undergone the first major stress since the 2008-09 financial crisis, or because they were a significant event at the time. They include:
Penn Square Bank – July 1982
Continental Illinois Bank – July 1984
Drexel Burnham Lambert – February 1990
Long Term Capital Management – September 1998
Bear Stearns Mortgage Funds – July 2008
Bear Stearns – March 1998
IndyMac Bank – July 2008
Lehman Brothers – September 2008
Silicon Valley Bank – March 2023
TLDR: Most Bank Crises Follow a Similar Story
While the circumstances of every failure vary, they mostly follow a very similar storyline. We outline the basic plot here.
Problems usually start years before the final crisis that leads to failure. The final crisis, when it comes, usually happens in the context of broader stress in the market. The Federal Reserve (Fed) may be raising rates to fight inflation or cool a hot labour market. The economy may be contending with recession concerns. Crises rarely happen out of the blue when things are mostly good.
The problematic firm suffers some setback, whether larger-than-expected losses, or a rating downgrade that limits access to financing. In the case of banks, depositors start withdrawing funds.
As conditions worsen, regulators typically start providing support to try to stabilize the situation. If that is not enough, they may extend financing or take other steps. If that is still not enough, they eventually step in and usually arrange a sale to a solvent institution, with whatever support needed to facilitate the deal.
Equity and bond markets respond differently. The primary selloff in equities often happens weeks earlier, as it becomes clear that the troubled firm may not survive or will need significant help. Much of the equity volatility around the failure is often due to other things happening in the market and economy – whether energy prices, recession fears, or weak earnings reports. It is often difficult to attribute the volatility to the crisis institution.
Bond markets often experience a flight-to-quality stage, with the three-month Treasury bill (T-bill) in particular rallying sharply as the crisis reaches a peak.
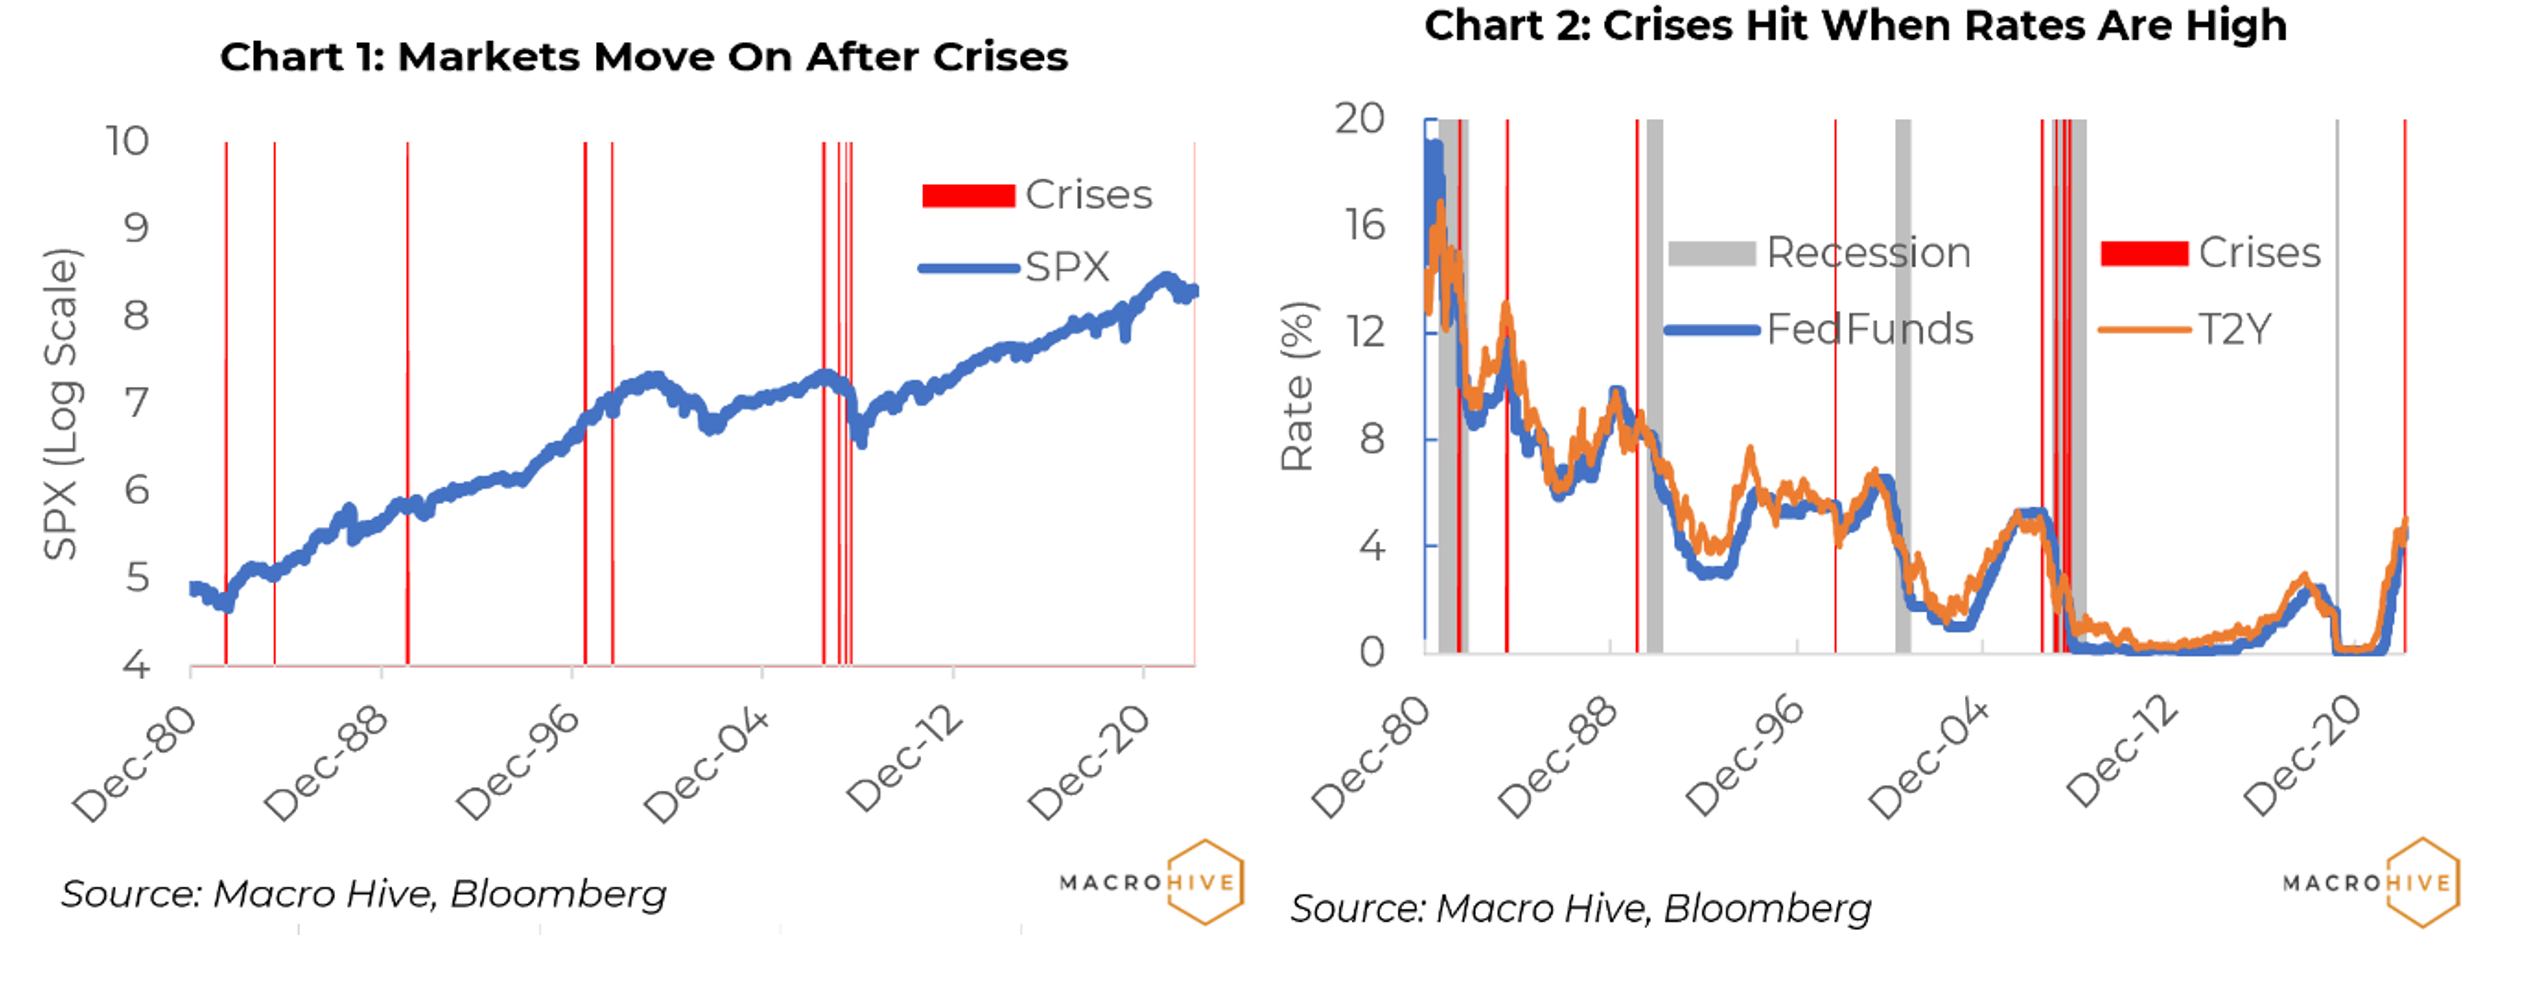
But a key point is that markets usually move on quite quickly after a major firm fails (Charts 1 and 2). This is a testimony to the effective steps that regulators take to resolve failed institutions.
The one exception was the Lehman bankruptcy in September 2008. This was a case where regulators made major policy missteps in how they handled the Lehman situation. Rather than a few unsettled weeks, it took years for markets and the economy to regain something like a normal footing.
There are two lessons here.
- For investors caught in a crisis downdraft, the best strategy is to wait it out. Markets nearly always soon recover.
- That said, crises are no time for complacency. There is some panic selling and flight to quality because it is always possible that policymakers will make a mistake and make a bad situation very bad. That pressure from markets may be what it takes to push regulators into action.
More Trouble to Come?
Currently, the banking crisis around SVB (and Credit Suisse) appear to have been successfully resolved. Broader equity markets have largely recovered to pre-crisis levels. Rates are still sharply lower on expectations that the Fed’s rate hiking campaign against inflation is nearly over.
Still, the problems that hit and sunk SVB are more systemic in nature. Many banks have underwater bond portfolios or commercial real estate mortgages where properties are suffering from low occupancy rates. Many banks are experiencing deposit outflows as people seek government money market funds that pay far higher rates of interest than banks.
Regulators have done little to address these potential problems. Yes, there is discussion of extending deposit insurance coverage, but that will not stop funds seeking out higher returns.
Most telling, bank-related ETFs dropped about 30% when SVB’s problems became apparent, and have traded in a narrow range near the lows since.
In short, it remains to be seen whether the SVIB crisis has passed.
Penn Square Bank
Penn Square Bank was declared insolvent on July 5, 1982 after years of breakneck growth and lending to the energy sector.
Penn Square turned to oil and gas lending in the mid-1970s. Between then and 1982, assets and deposits grew 15-fold to $525 million and $450 million, respectively. It originated over $2 billion of loans to the oil patch, and sold 75% of them to other banks in the form of participations, while continuing to service the loans.
When oil prices dropped in the early 1980s loan defaults rose, and depositors started withdrawing funds as early as a year before. That accelerated in May 1982. By early July, Penn Square was insolvent.
At that point, about half of insured deposits exceeded the then statutory insurance limit of $100,000. Much of the uninsured amount was jumbo CDs and deposits from other banks eager to reap high rates offered by Penn Square.
In most previous bank failures covered by the Federal Deposit Insurance Corporation (FDIC), the failed bank was acquired by another bank, and uninsured deposits were transferred without loss. In the case of Penn Square, no bank was willing to assume the uninsured deposits, probably because they carried high rates and would presumably vanish at maturity. Uninsured depositors were stuck with the loss.
The Penn Square default led to a cascading of other bank failures due to souring energy sector loan participations and loss on uninsured deposits. Among them was Continental Illinois (see below).
Market Impact
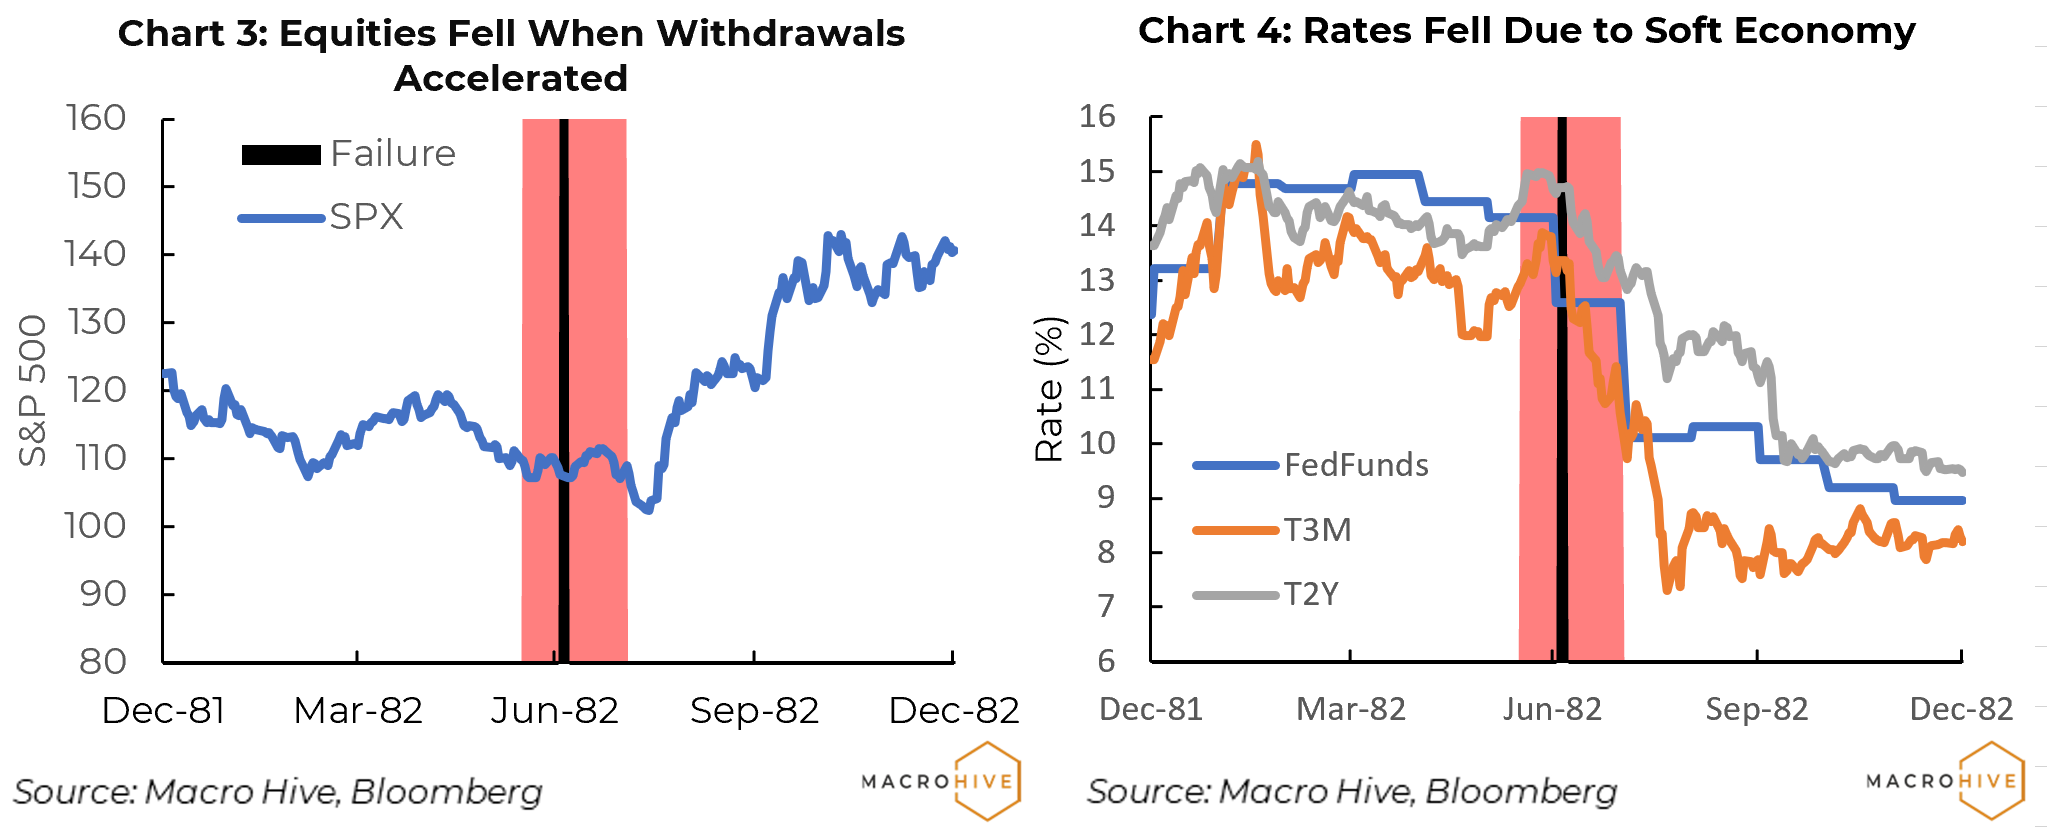
It is difficult to separate the Penn Square failure from the 1981-82 recession, which was approaching its nadir at the time. Equities sold off about 10% starting in May 1982 as deposit withdrawals accelerated. They dropped another 3% when the FDIC took over the bank (Chart 2).
After trading in a narrow range for a few weeks, equities dropped another 8%, but more due to ever growing gloom about the economic outlook. Then abruptly the market turned on 13 August when Salomon Brothers economist Henry Kaufman (aka ‘Dr. Doom’) declared that Treasury yields had peaked. That set off what proved to be a multi-decade rally.
On the rate side, the Fed cut rates in May, and again in July before and after the Penn Square failure. But this was as much if not mostly due to the weak economy (Chart 3).
All things considered, the market response to Penn Square failure was relatively muted. This is partly because the problems were telegraphed well before the actual failure, and the bad news had already been priced into the market; and because the economy was in the second leg of a double-dip recession after Paul Volker pushed the Fed Funds rate over 17% in 1980.
Continental Illinois Bank
Continental Illinois Bank finally succumbed to government control on 26 July 1984, after several previous efforts to save it failed. At the time it was the largest bank in the US, with $40bn in assets.
Continental Illinois embarked on an aggressive growth strategy in the 1970s. To get around limits on branching outside of Illinois it purchased loan participations from other banks, including $1 billion from Penn Square. It was also involved in international lending and was hit by losses when Mexico defaulted in August 1982.
In Q1 1984, Continental Illinois announced nonperforming loans jumped 20% to $2.3 billion. In May 1984, a bank run started. It had $28.3bn in deposits at the time, of which nearly 75% was uninsured. Some 2300 banks around the country had deposits in Continental Illinois, of which half were greater than $100,000 – the insurance ceiling.
In the next few days Continental secured a $3.6bn loan from the Federal Reserve Bank of Chicago and a $4.5 billion line of credit from other banks. A week after the run started the FDIC took the unusual step of providing a $1.5bn capital infusion. The next day it announced that uninsured depositors and general creditors would be covered against losses.
Despite this support the run continued, until the FDIC took control of the bank and ran it for the next seven years.
Market Impact
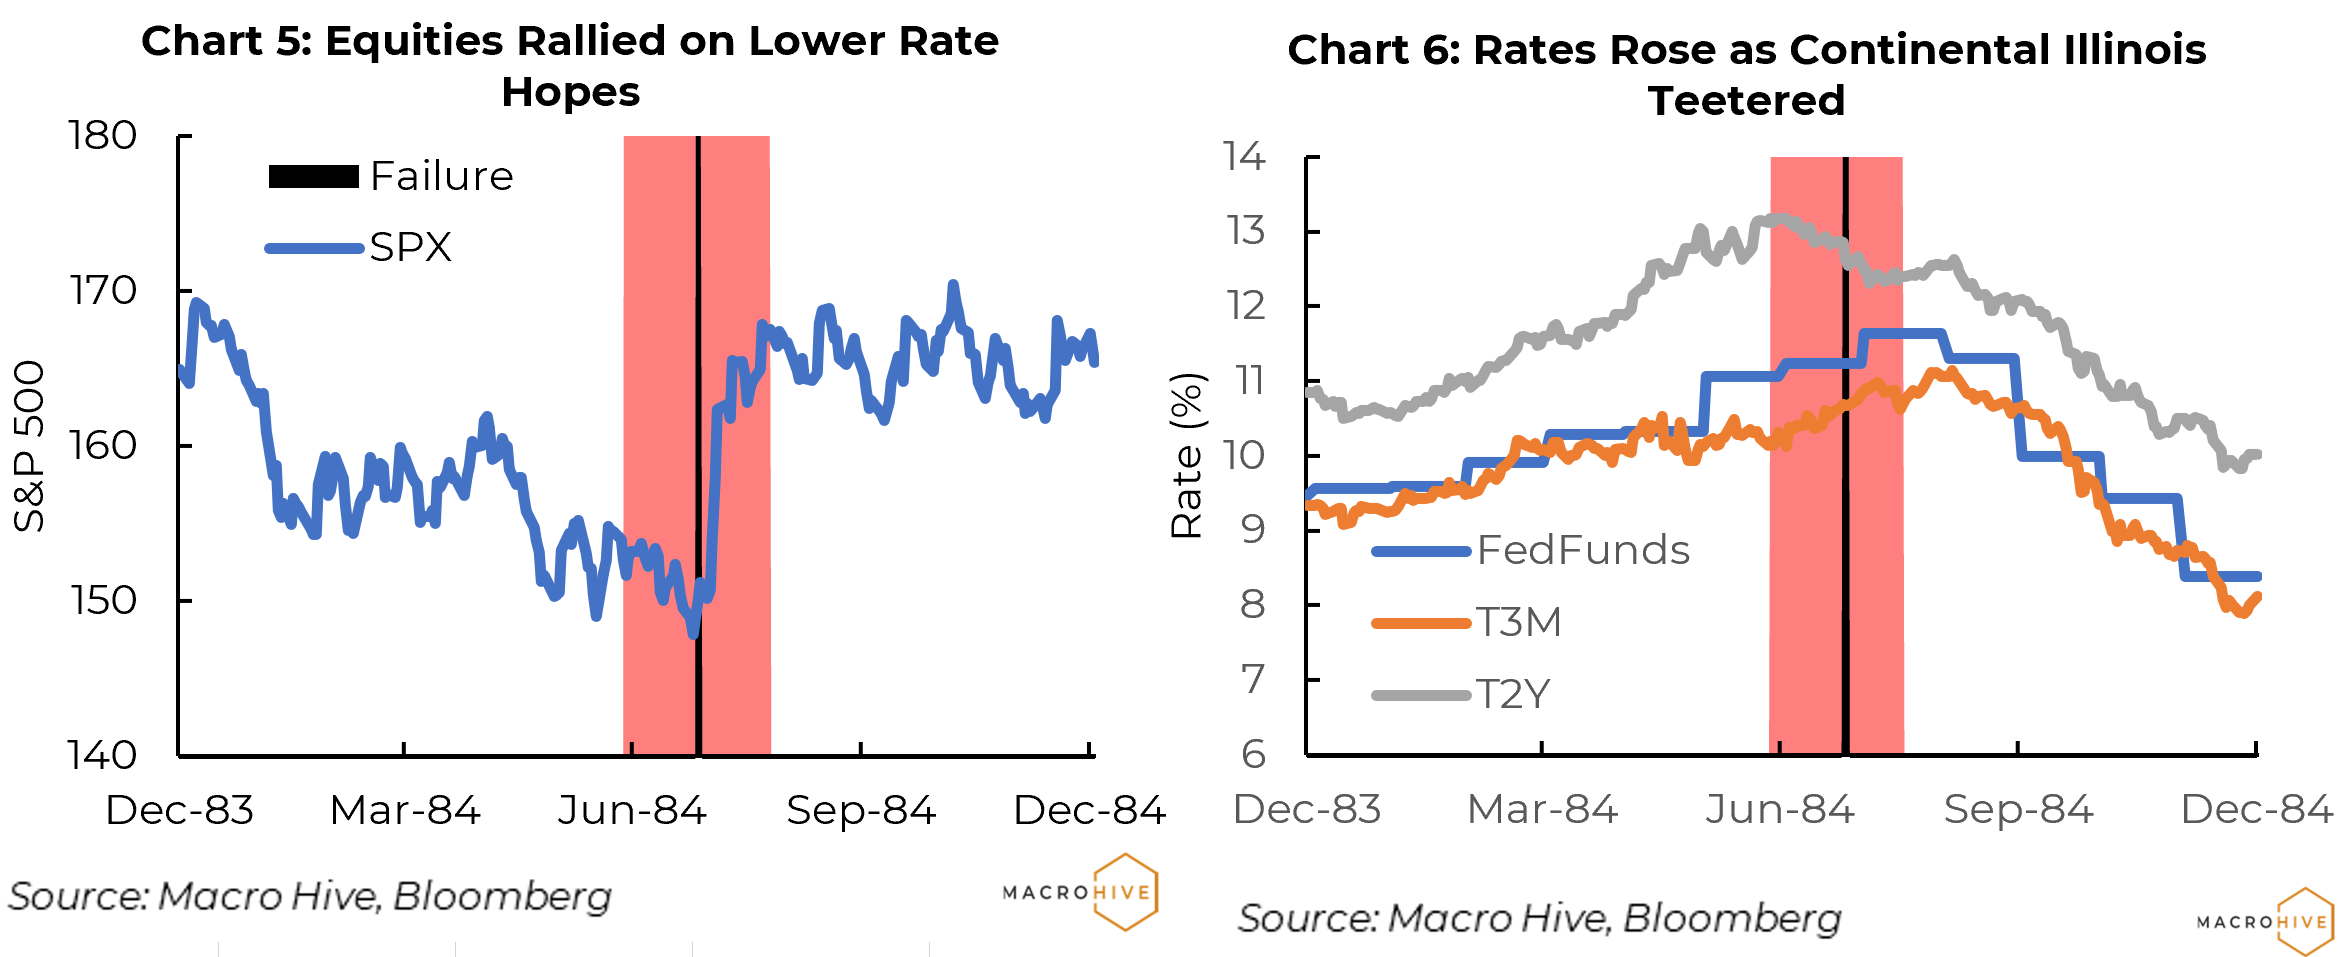
As with Penn Square, the market impact around the takeover was minor. Continental Illinois had been struggling for more than a year, and its problems were well known. Most of the equity selloff occurred when the first major run started in May 1984 (Chart 4). Equities did drop about 3% just before the bank was taken over, but that was as much due to economic uncertainty as the bank situation. The sharp equity rally after the FDIC took control occurred in response to unexpectedly weak economic data, which lifted hopes that the Fed would soon start cutting rates.
On the rates side, the Fed had been raising rates to cool off the economy (Chart 5). Paul Volcker did hold back on planned rate increases as tensions mounted in Q2 1984. The subsequent decline in rates was because the Fed accomplished its goal, not because of Continental Illinois.
Drexel Burnham Lambert
When Drexel filed for bankruptcy on 13 February 1990, the firm had been under various legal pressures for years.
Drexel had been an aggressive investment bank during the late 1970s and first half of the 1980s. It rose to be one of the bulge bracket firms of Wall Street. A key element was the junk bond underwriting and trading operation that Michael Milken developed.
Troubles started mounting in 1986 when Drexel investment banker Dennis Levine was charged with insider trading. It turned out his partner in the scheme was Ivan Boesky. Other charges were brought against Drexel, including stock manipulation and insider trading in the junk bond market. Rudy Guiliani, then a young federal prosecutor, threatened to charge Drexel under the Racketeer Influenced and Corrupt Organizations Act (RICO). The indictment alone would have hobbled Drexel’s ability to borrow money or do business, so it settled charges in April 1989.
But the business environment had worsened, and Drexel was unable to rekindle its banking or junk bond business. Come February, it was left with little choice but to file for bankruptcy.
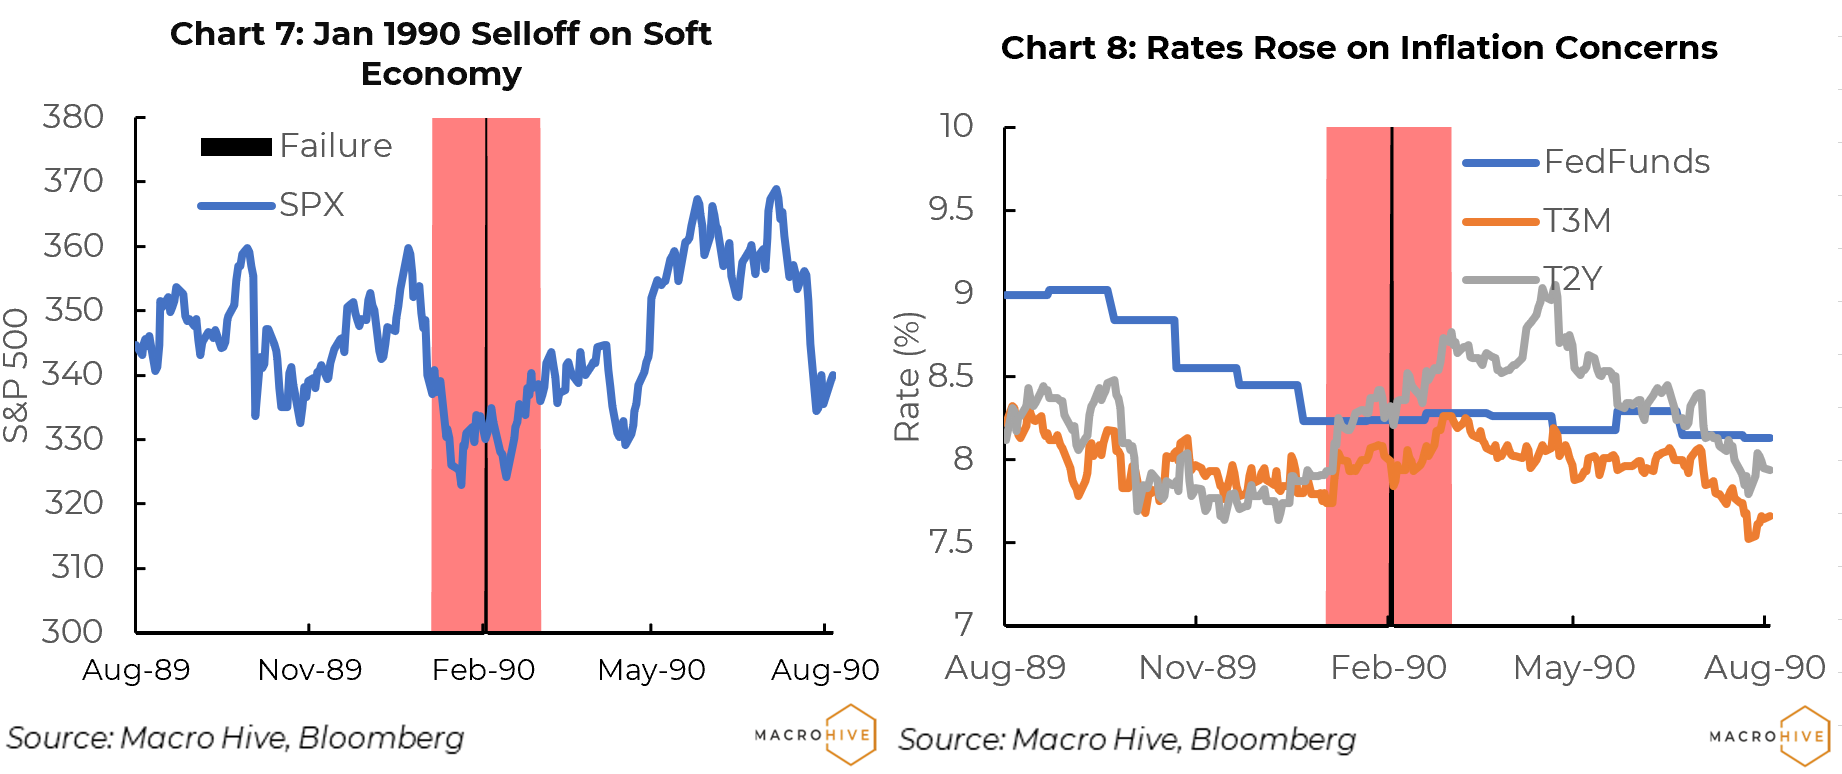
As with Continental, the Drexel situation was a slow-moving train wreck. It is difficult to attribute market stress to Drexel’s downfall. Most of what drove the selloff in January 1990 was concerns about a darkening economic outlook, as well as ongoing fallout from the thrift crisis (Charts 7 and 8). In August 1990, the economy entered a recession that lasted three quarters.
Certainly, the Fed felts no need to take special action over the Drexel bankruptcy. Indeed, inflation perked up from 4.5% in Q3 1989 to 5.3% in early 1990, leading to a selloff in 3-month and 2-year Treasuries on concerns that the Fed might raise rates.
Long Term Capital Management
Long Term Capital Management (LTCM) was bailed out on 23 September 1998 when 14 Wall Street firms provided a $3.6bn capital infusion. LTCM was established in 1994 as a long/short hedge fund. It sought to capitalize on mispricing between various fixed income securities, amplified by leverage. For several years it was enormously successful, with returns in the 40% range.
By 1997, other hedge funds and proprietary trading desks at Wall Street firms were copying LTCM trades, making it more difficult to achieve that kind of profitability. LTCM broadened into emerging market debt and increased leverage. But the Asian financial crisis of 1997 led to growing risk aversion and some capital withdrawals, forcing LTCM to unwind positions at a loss and take a hit to its capital base.
When Russia defaulted on local currency debt on 17 August 1997, LTCM was hit with another large loss from which it could not recover. After failing to raise more capital, the Federal Reserve Bank of New York (FRBNY) organized a bailout where 14 Wall Street firms contributed $3.625bn to keep LTCM going. Bear Stearns was noticeably absent – a decision that would affect its fortunes nearly a decade later. The original partners lost all of their $1.9 billion of personal investments.
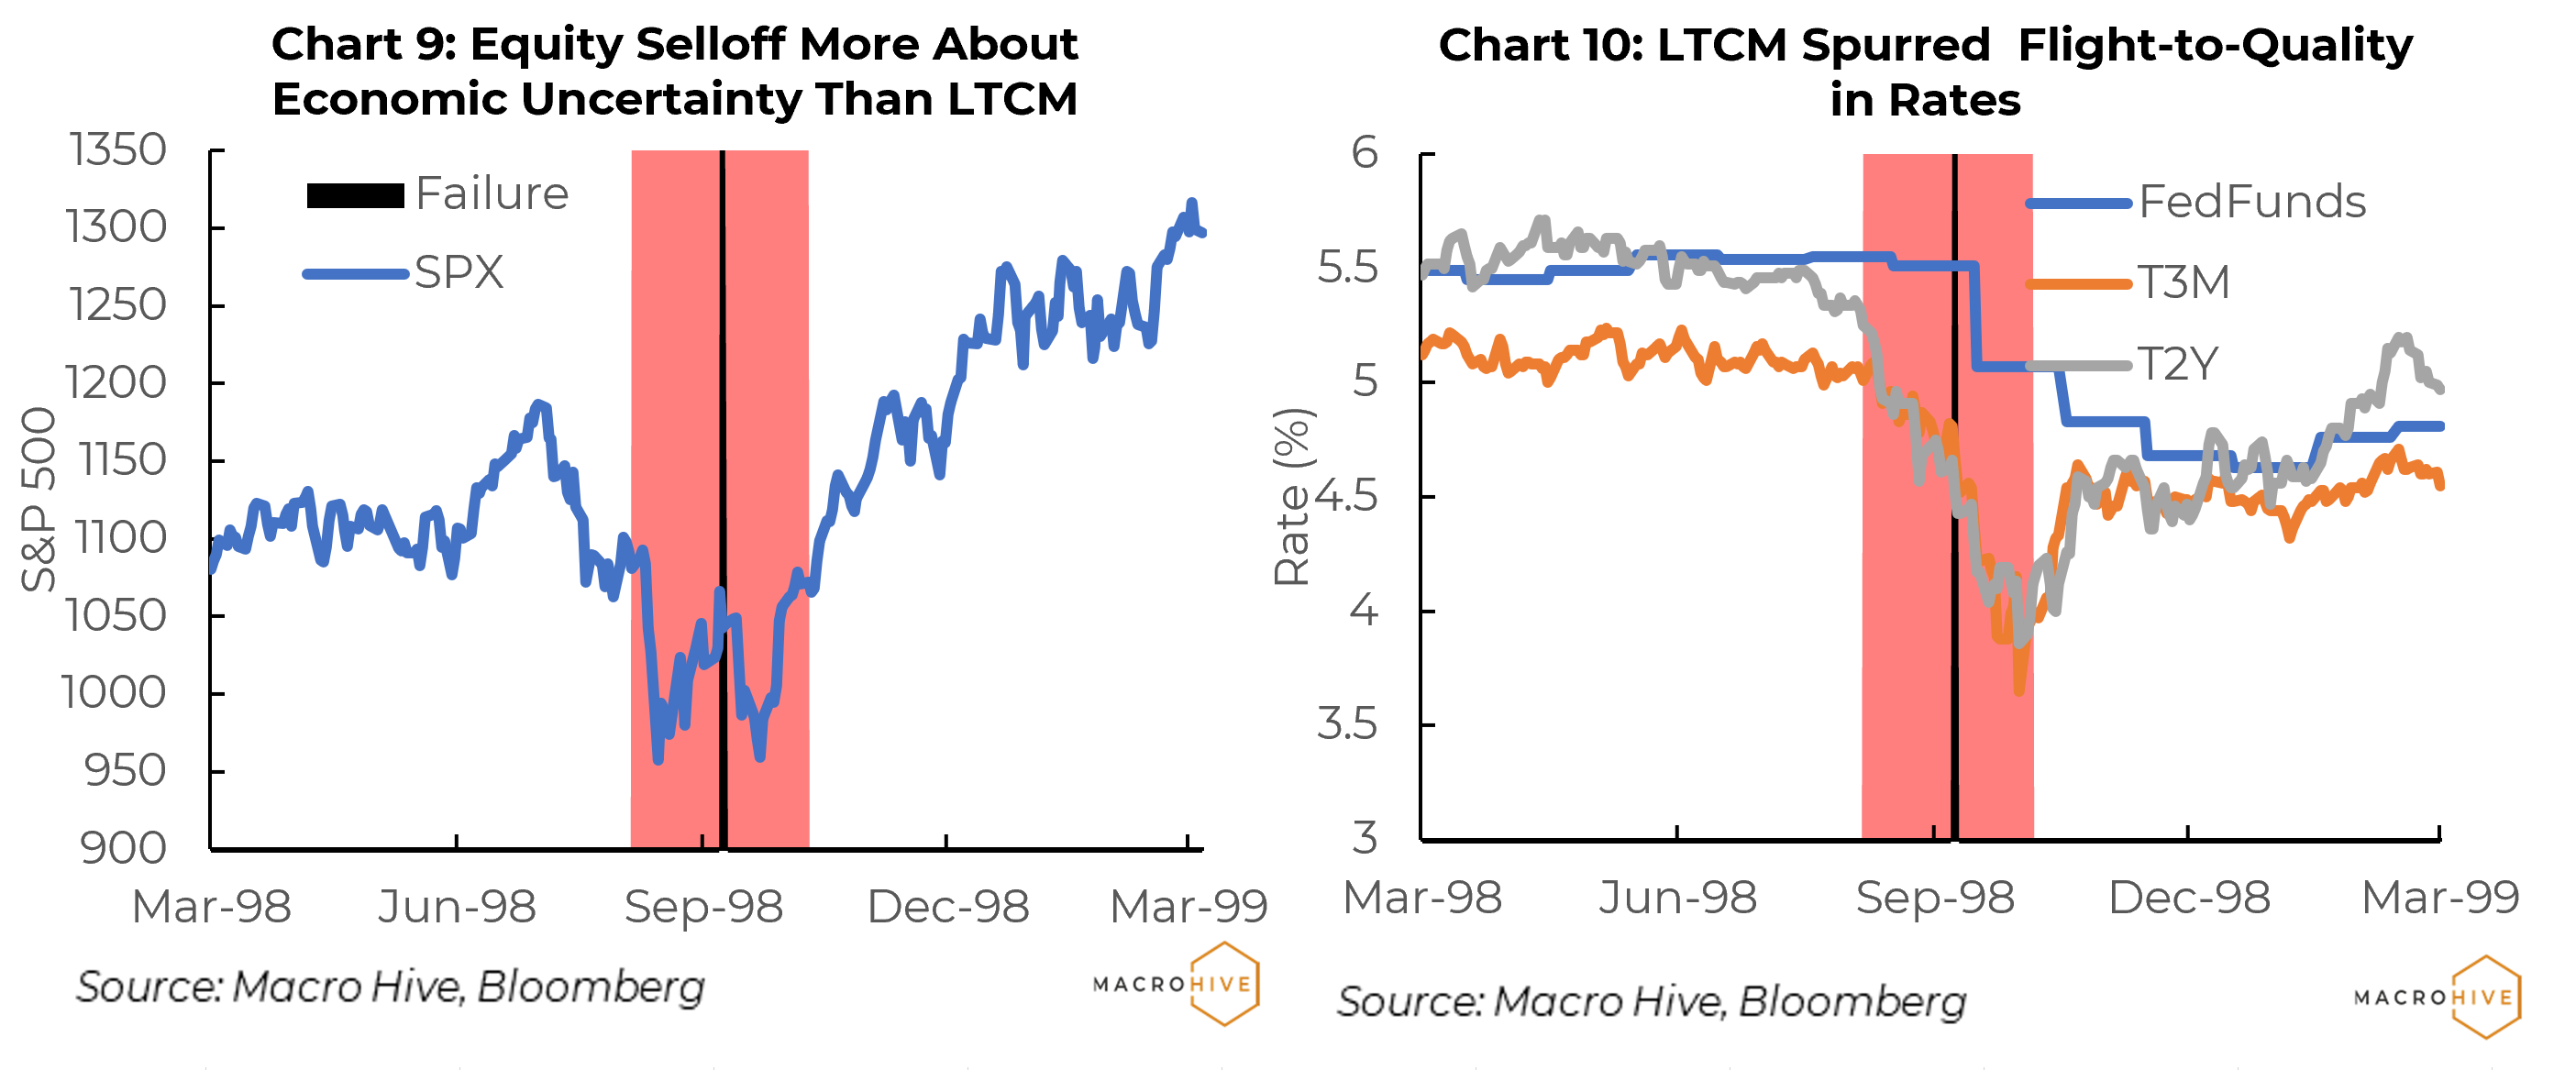
News reports make little mention of LTCM in the weeks before the bailout. The selloff in early August came when a G7 meeting failed to announce concrete steps to address growing economic problems (Chart 9).
When equities sold off in late August, the primary concern was the impact of the Russian default on emerging markets and the global economy. The subsequent rally in early September was due to hopes that the Fed would soon cut rates. Equities sold off sharply after the LTCM bailout, partly because of concerns about other financial firms, but also because of profit warnings by blue chip companies. Markets then rallied sharply as the Fed moved ahead with rate cuts.
In the rates market, mounting concerns about LTCM and other financial firms sparked a flight to quality that only ended with a 25bp cut in Fed funds in early November 1998 (Chart 10).
There was clearly market turmoil around the LTCM bailout. But there were a lot of other economic problems at the time both domestically and globally. Had Russia not defaulted, LTCM might not have failed; or if it did fail, the impact might have been smaller.
Again, it is difficult to separate market impacts from LTCM from the broader landscape at the time.
Bear Stearns Mortgage Funds
Two Bear Stearns mortgage hedge funds filed for bankruptcy on 31 July 2007.
Troubles had been mounting since early 2007 as delinquencies and then defaults on subprime mortgages rose. In June 2007, parent Bear Stearns provided a $1.6 billion bailout to buttress the funds’ capital bases and help them meet margin calls.
It was too little too late. On 15 July, the fund managers said one fund had lost 90% of its capital and the other virtually all its capital.
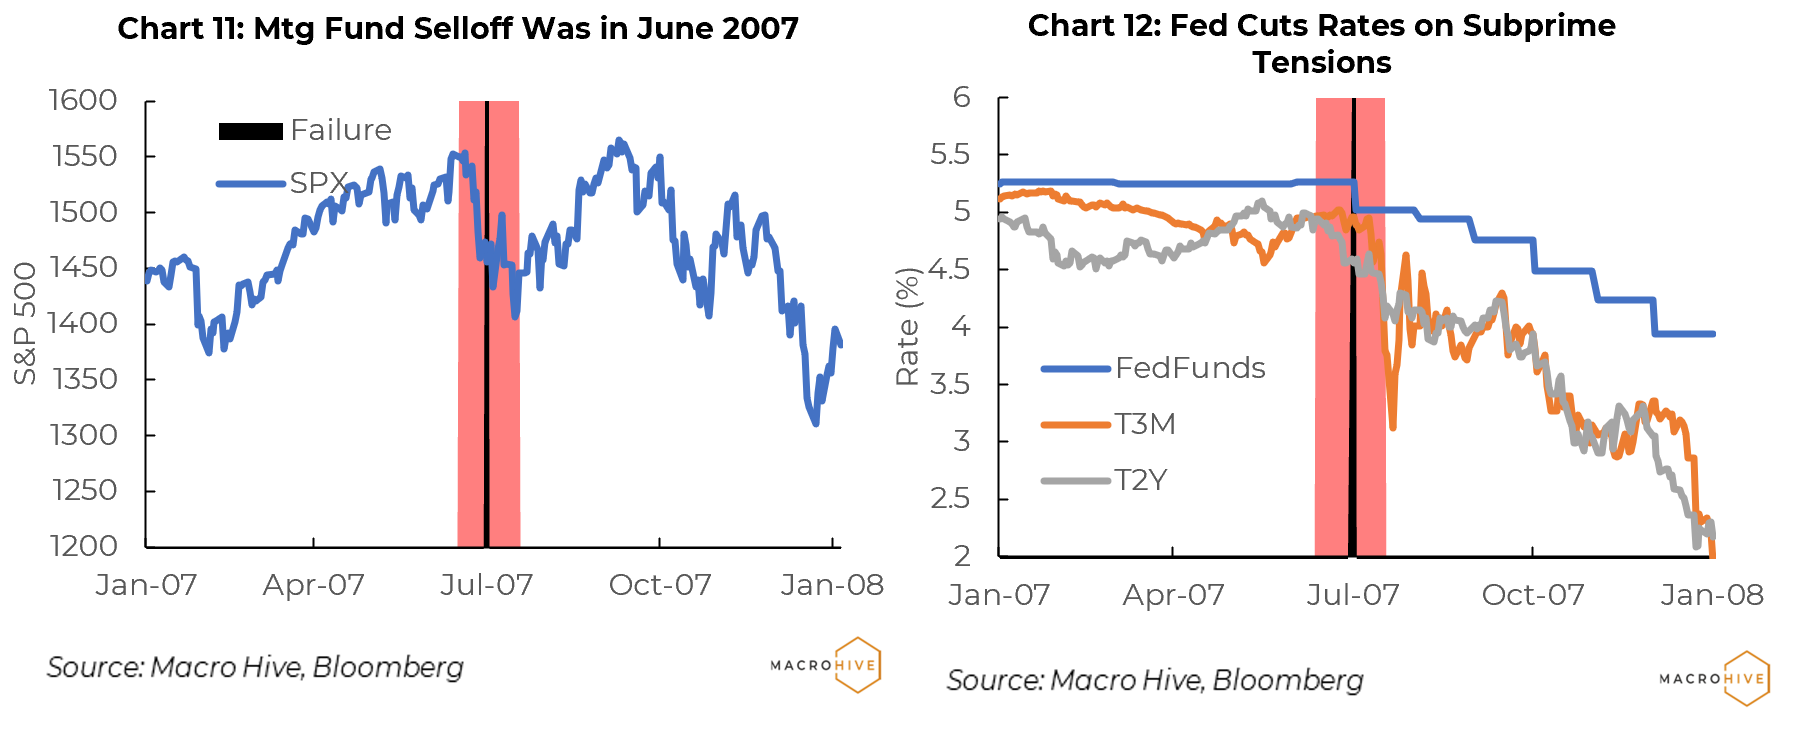
Much of the direct market volatility due to the Bear Stearns funds happened in mid-June, when the full extent of the funds’ problems became clear (Chart 11). The S&P 500 bounced in a 3% range on news reports of losses and various proposed fixes. With the strong show of support from Bear Stearns, equities rallied until mid-July.
Then around 20 July, the S&P 500 dropped a sharp 6.6% over a few days – but the mortgage funds were the least of it. Homebuilders and mortgage companies announced large losses. The scale of subprime mortgages was only starting to come into focus. Apart from that, concerns about a recession were rising. Those were temporarily eased when the Fed cut the Fed funds rate 50bp on 17 September, setting off a rally that took the S&P 500 back to 1560. It would not return to that level until April 2013.
The rates market appeared to largely take the mortgage fund problems in stride, although there was a brief flight to quality in June, when problems first came to light. In mid-August the Fed had executed a large volume of repos to inject liquidity into the banking system, in an effort to calm rising market jitters – but that move only fanned concerns about credit risk and set off a massive flight to quality on 20 August when the three-month T-bill rate dropped from 4.7% to 3.1%.
Bear Stearns
Bear Stearns ended its run as an independent investment bank on 16 March 2008 when a rescue plan failed and JP Morgan Chase purchased it.
There is little question that Bear Stearns was wounded after its two mortgage funds collapsed in July 2007. By early August investors in the funds sued the company on grounds that the fund managers had misrepresented the performance of the funds. Barclays Capital and others sued later. In November 2007 Bear Stearns said that it was writing down $1.2 billion of mortgage assets and would post a loss for the first time in 83 years. S&P downgraded the company to single-A from double-A.
As pressures mounted, Bear Stearns turned to the Federal Reserve Bank of New York (FRBNY), which agreed on 14 March 2008 to provide liquidity support in the form of a 28-day $25 billion collateralized loan. This was soon rescinded, and JP Morgan purchased Bear Stearns for $2 per share, later increased to $10. It had been trading at $93/share just weeks earlier. The FRBNY took on $30 billion of distressed mortgage assets and placed them in Maiden Lane LLC, with JPM holding a $1bn first loss position.
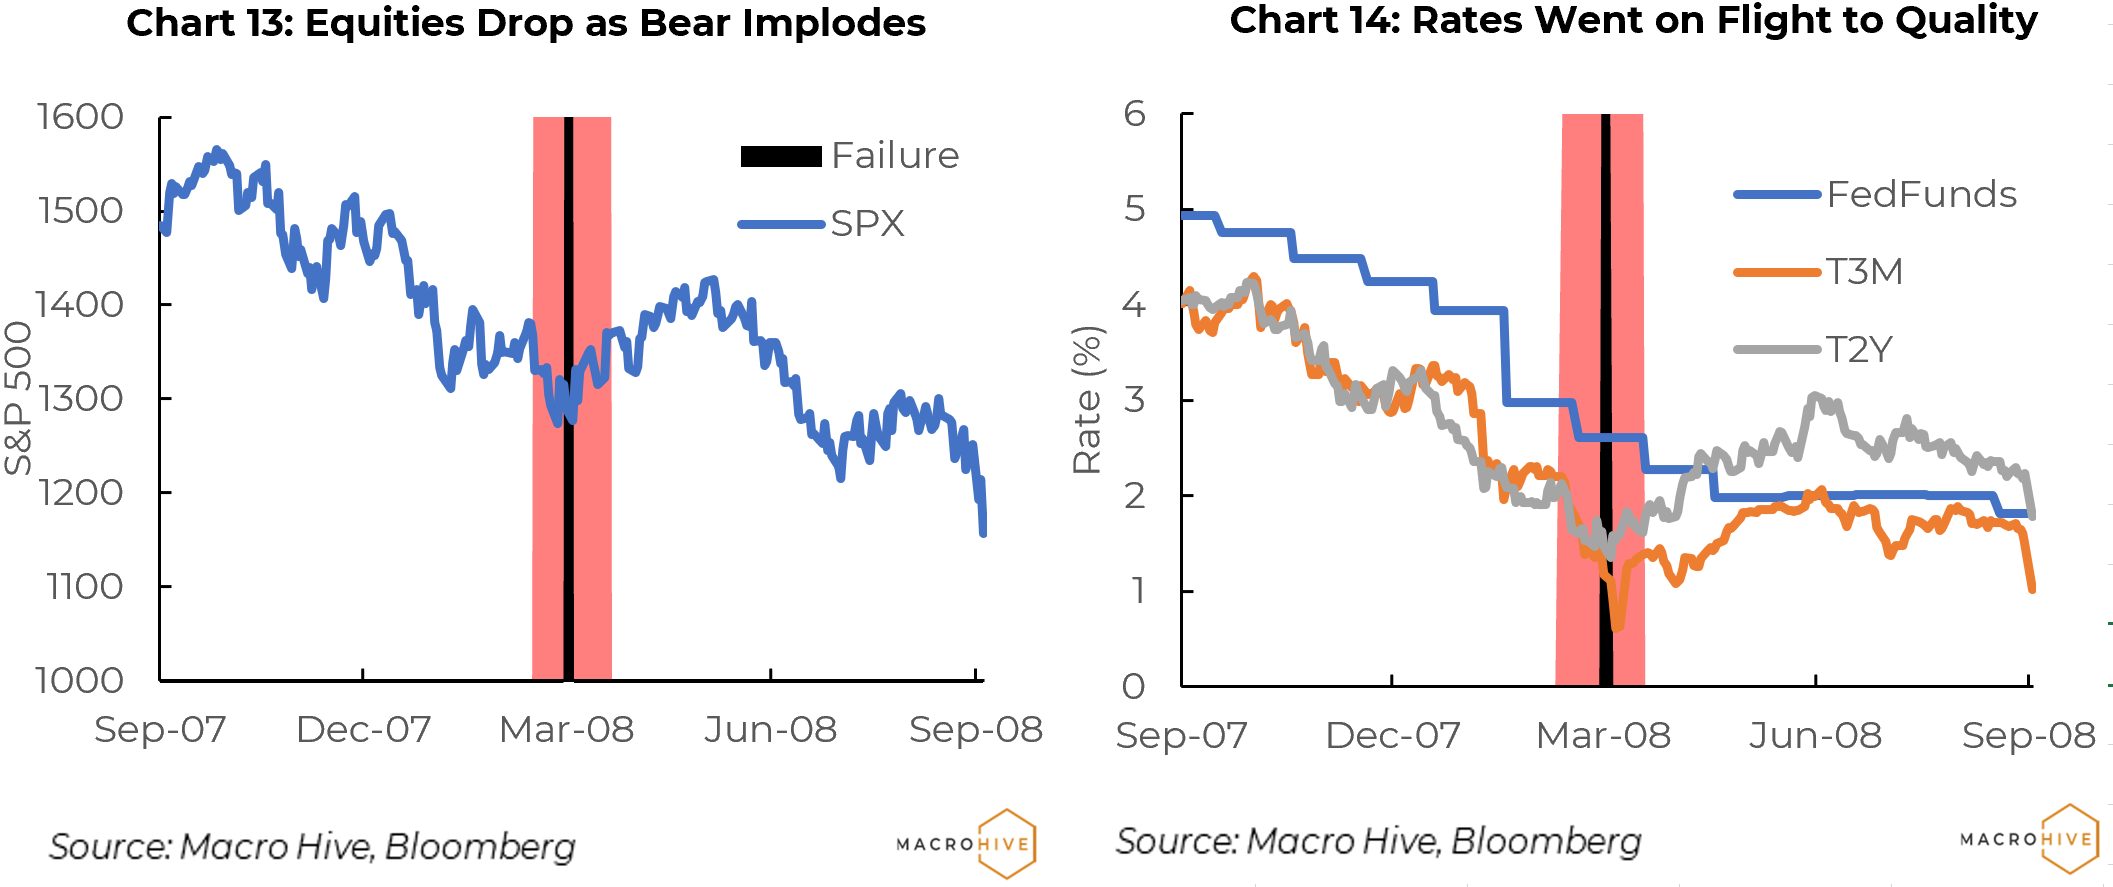
The Bear Stearns meltdown did have a perceptible impact on markets. The S&P 500 dropped nearly 7% in the two weeks before the JPM acquisition (Chart 13). Rates went into a flight to quality, where the 2-year Treasury fell from 2.2% to 1.1% (Chart 14). Both equities and rates gradually recovered with the balm of further rate cuts, but any sense of relief faded by the second half of May 2008 when rising oil prices and weak housing set off another round of selling.
IndyMac Bank
IndyMac Bank failed on 11 July 2008. In the years before it failed it had grown rapidly, more than quadrupling its mortgage origination volume. With $32 billion in assets, it was the largest bank failure since Continental Illinois ($40 billion in assets) in 1984.
IndyMac made its mark by originating Alt-A mortgages – loans to people with good credit but who could not verify their income because they were self-employed or lacked other documentation. These came to be known as ‘liar mortgages.’ Unlike many other mortgage originators, IndyMac financed mortgages with deposits and held many of its originations in its portfolio.
In the months before it failed IndyMac was racking up losses on its mortgage holdings, until it was deemed undercapitalized by the FDIC.
IndyMac was notable in that the FDIC chose not to cover uninsured depositors. As it turned out, some 95% of its deposits were insured, and uninsured depositors, totalling about $1.5 billion, received about half of their funds. Still, the political blowback was intense, and the FDIC has covered virtually all uninsured depositors in subsequent bank failures.
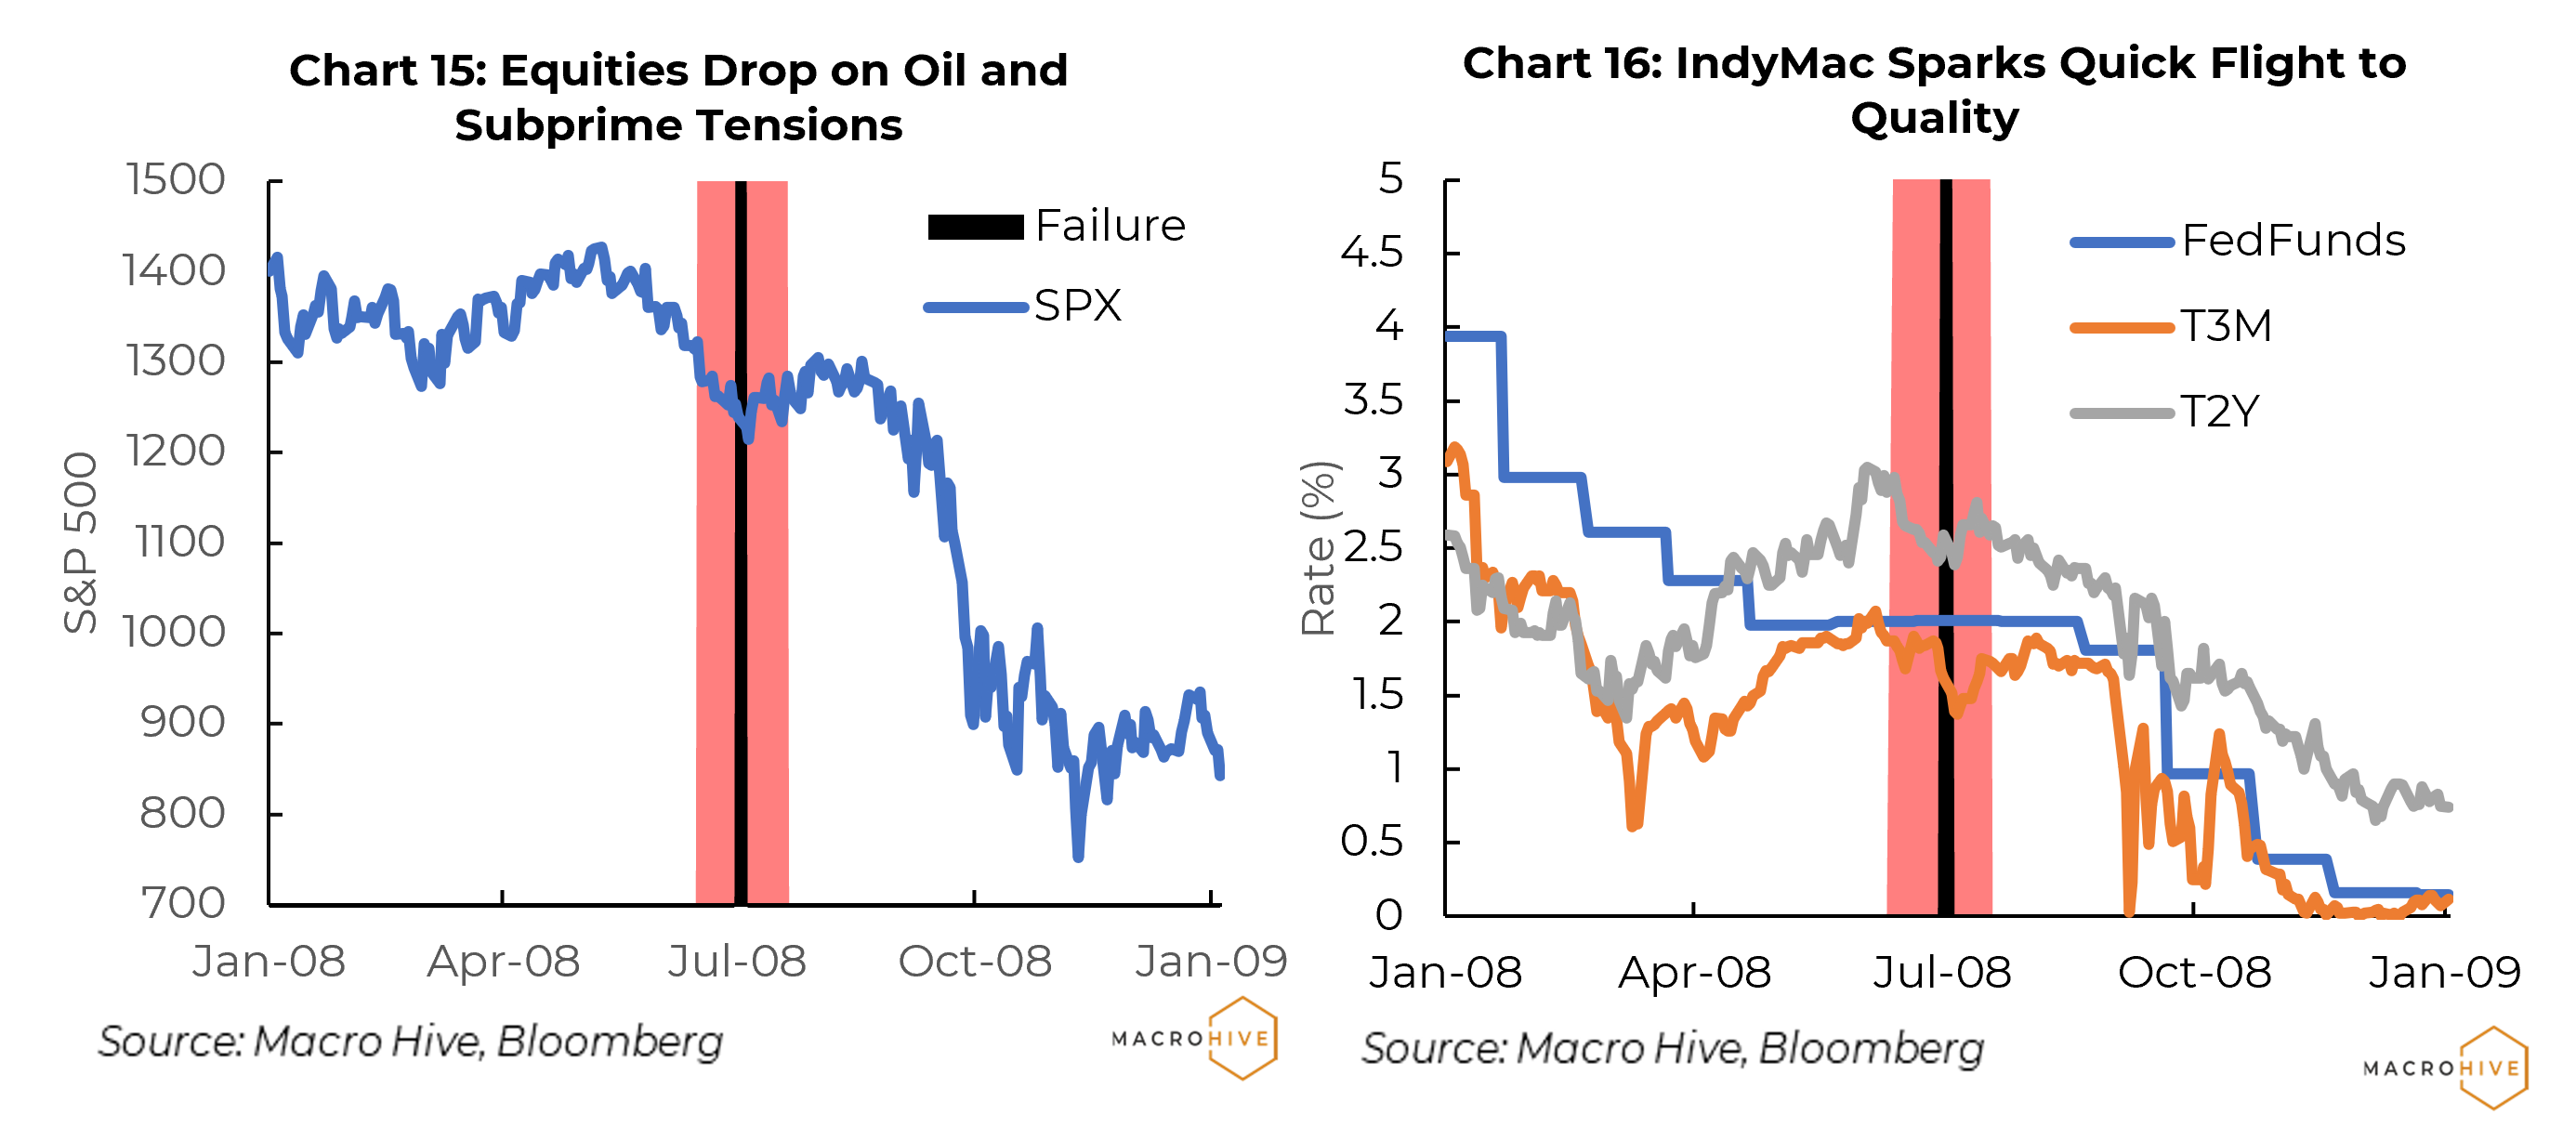
IndyMac’s problems and failure did not cause significant disruption in the equities or rates markets. Equities sold off in the weeks before IndyMac failed because of ongoing concerns about subprime mortgages broadly, and because of the rising price of oil, which peaked at $146/bbl in mid-July (Chart 15). There was brief flight to quality in the rates market as the three-month T-bill rate dropped 40bp to 1.4%, but it soon recovered.
Lehman Brothers
Lehman Brothers filed for bankruptcy on 15 September 2008.
Lehman had been a big player in the subprime and Alt-A mortgage origination business. It securitized these mortgages and sold highly rated tranches to investors. It retained lower rated tranches. By early 2008, Lehman had $680 billion in assets supported by $22.5 bn of capital. As the subprime mortgage defaults rose in 2008 Lehman faced rising losses. In August the Korea Development Bank considered buying Lehman, but any potential deal was vetoed by Korean regulators.
In early September, Lehman’s stock kept dropping even as Lehman made efforts to shore up its balance sheet. By September 12 the FRBNY convened a group of Wall Street firms to try to find a way to arrange a sale or cash infusion, but this effort failed, leaving Lehman with no choice but to file for bankruptcy.
Given what we now know about the impact of the Lehman collapse, the market response is interesting. The Fed considered whether to cut rates or take other steps to support markets, but ultimately decided not to, on the thought that this was just another subprime-related bank failure, and probably would not have significant broader market impacts.
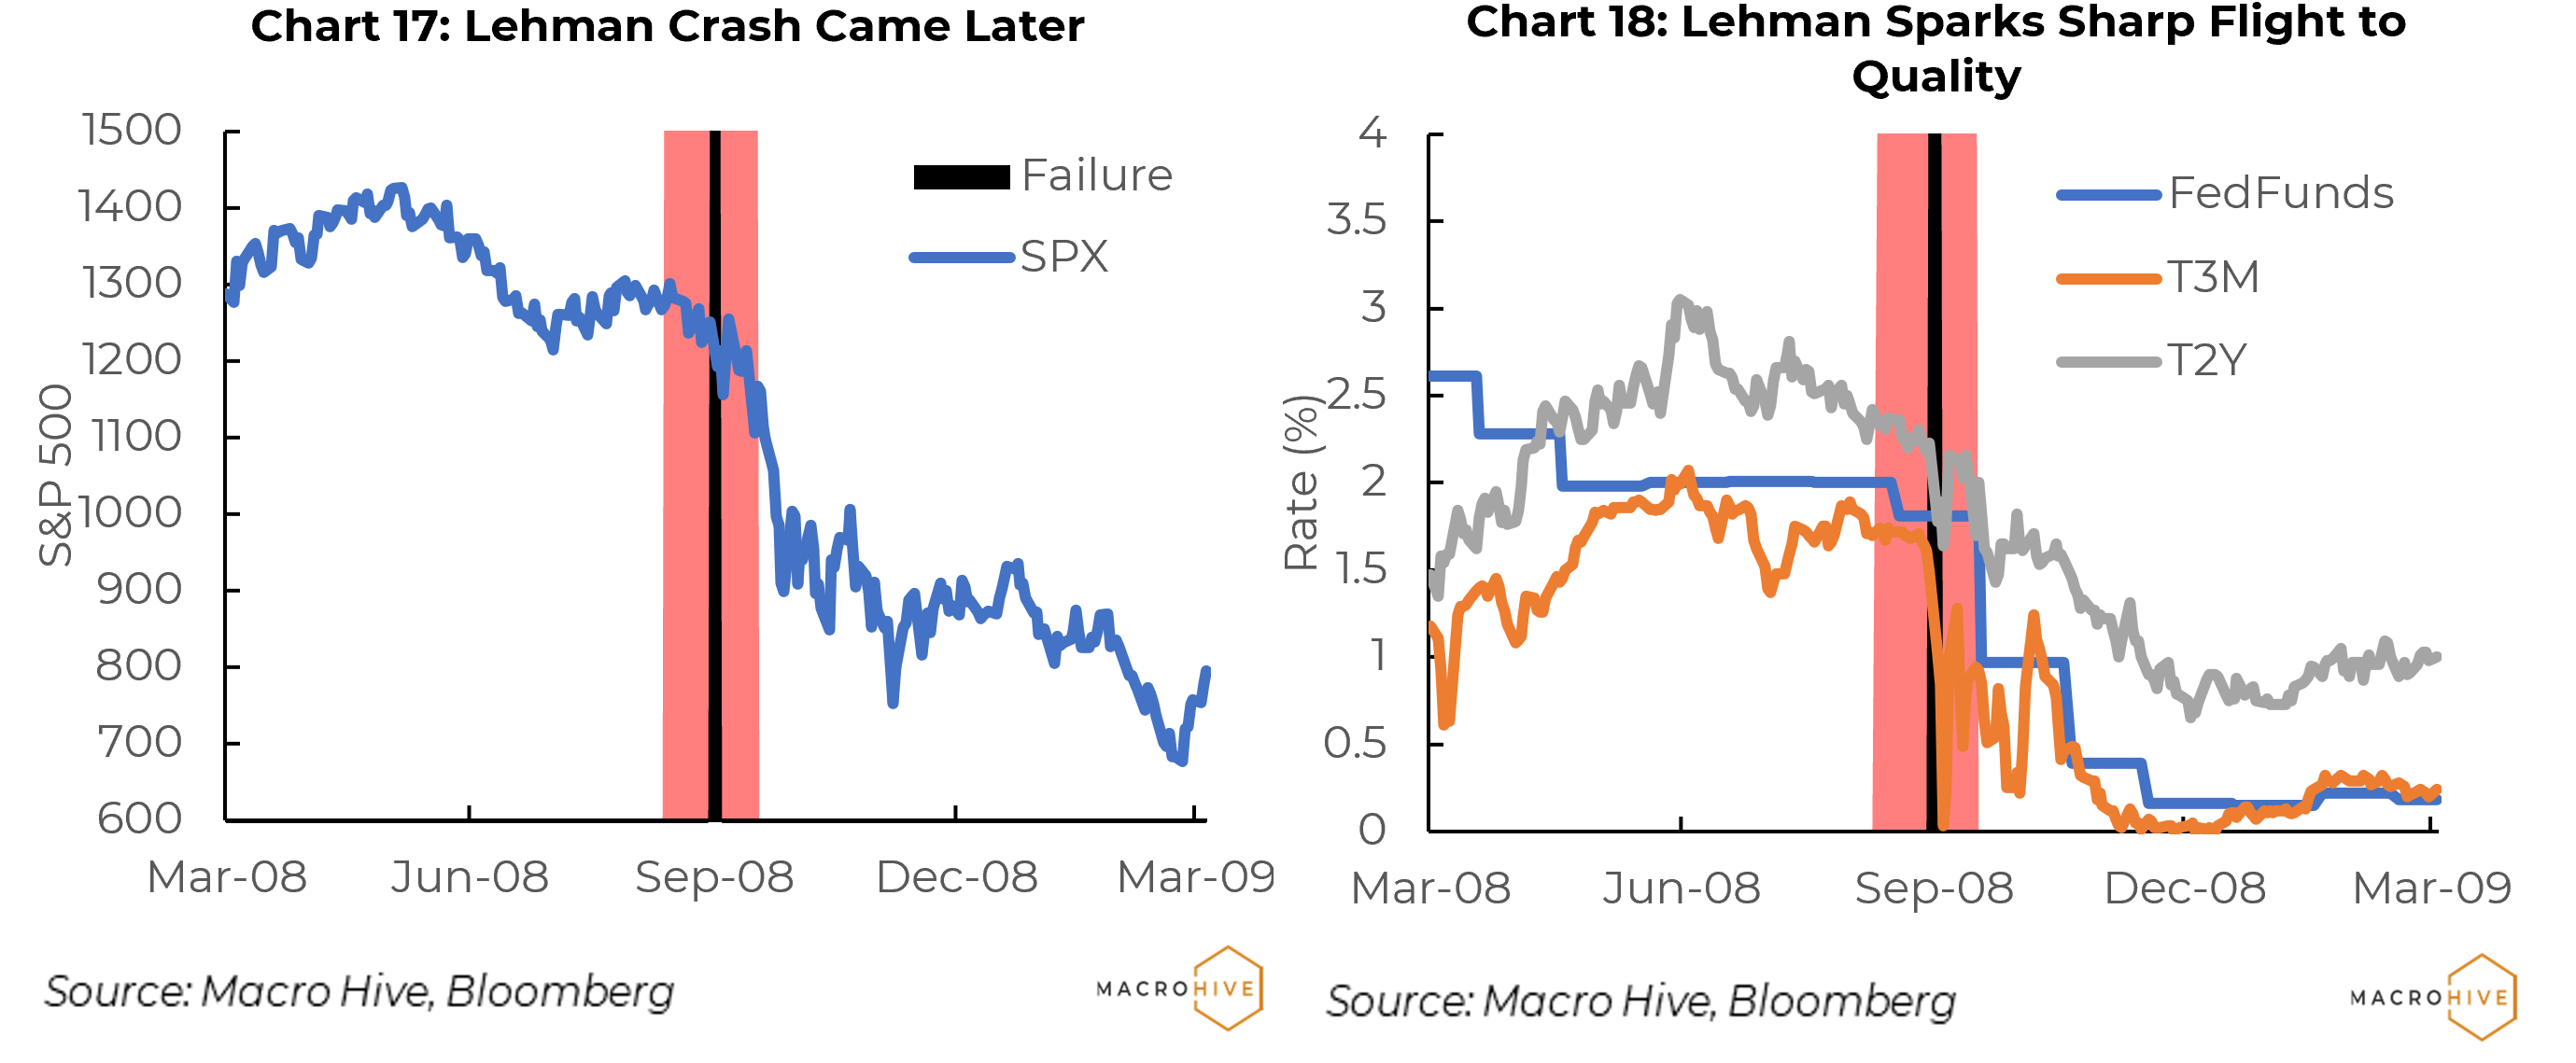
The S&P 500 dropped 7.5% just after the Lehman bankruptcy filing, then soon bounced back (Chart 17). The three-month T-bill dropped sharply from 1.5% to a shocking low of three basis points but soon recovered to near 1% (Chart 18).
It took a few more weeks for the full implications for markets and policymakers to realize the full implications of letting Lehman fail the way it did. In short order, Fannie Mae and Freddie Mac failed and were put into conservatorship. Merrill Lynch was forced into a merger with Bank of America. Triple-A rated AIG was pushed to the brink of bankruptcy before receiving a $182bn bailout – days after regulators had said there was no legal way to bailout or support Lehman.
Last but not least, apparently no one realized that Lehman was a huge player in the trade finance market – until global trade ground to a halt, taking the global economy with it.
As these cascading disasters mounted, the S&P 500 dropped from 1200 to below 1000, then 900, and ultimately below 700. By the end of the year, the Fed cut the Fed funds to near zero and embarked on an aggressive program of quantitative easing in the form of bond buying.
Lehman might have been yet another bank failure in a rough year with some short-term volatility. Instead, the Fed and Treasury committed what in retrospect was a major policy error in how it was done. While other failures generated ripple effects, the Lehman bankruptcy was an outright tsunami. It took years for financial markets and the economy to regain something like a normal footing. The Fed ended up keeping rates near zero until 2016.
Silicon Valley Bank
After some 15 years of relative quiet on the bank front, Silicon Valley Bank was a wake-up call, with an old-fashioned deposit run and a deeply underwater bond portfolio. Regulators took over the bank on 10 March 2023. It turns out that the Dodd-Frank legislation did not fix the banking system after all.
There are similarities between SVB and many previous failures. SVB grew very rapidly in the years before its collapse, with assets quadrupling between 2019 and 2022 to $211bn. Its loan portfolio was heavily concentrated in Silicon Valley startups. It had pursued a strategy of investing in government bonds when rates were low.
As rates rose the tech industry came under more pressure, and its bond portfolio had large unrealized losses. An estimated 85% of its deposits were above the $250,000 insurance limit.
As these problems became more widely known, depositors started transferring funds to other banks. In a matter of days, SVB was forced to sell securities at a loss to pay off depositors.
SVB differed from most other crisis situations in the sheer speed at which its finances deteriorated. This was likely due in part to social media, which spread the alarm almost instantaneously, and efficient ways to transfer money. Also, its problems were not credit related – they were due to interest rate risk and related losses in a rising rate environment.
Regulators moved very quickly on SVB because of fears that other regional banks could face similar deposit runs, especially if they had large uninsured holdings or large underwater bond portfolios.
As this is written, regulators appear to have contained the SVB problem. For now at least, other banks do not appear to be at risk of losing deposits, probably in large part because of implied assurances that the FDIC will cover uninsured deposits. But there is still an ongoing debate about this, and no blanket coverage has been actually declared.
Market Impact
Equity and rates markets responded with alacrity in the days before SVB failed (Charts 19, 20). Bank-related ETFs dropped about 30%. The S&P 500 fell slightly when SVB failed, but has mostly traded in a narrow range, suggesting investors sold bank stocks and moved into other sectors. The three-month T-bill fell 100bp, from near 5% to 4%.
Particularly telling is that neither bank ETFs nor rates have shown any sign of recovering. This is still an evolving situation, but it strongly suggests to us that investors expect more turmoil in the banking sector; that the Fed will cut rates in response to either this turmoil or a slowing economy (possibly due to a cutback in lending); and that any impact that these events might have on corporate earnings will be offset by lower rates.
