This article is only available to Macro Hive subscribers. Sign-up to receive world-class macro analysis with a daily curated newsletter, podcast, original content from award-winning researchers, cross market strategy, equity insights, trade ideas, crypto flow frameworks, academic paper summaries, explanation and analysis of market-moving events, community investor chat room, and more.
We track scheduled flights (what’s planned) and tracked flights (what’s in the air) from a sample of the largest airports across the world. Looking at data up to 30 May, we find the following:
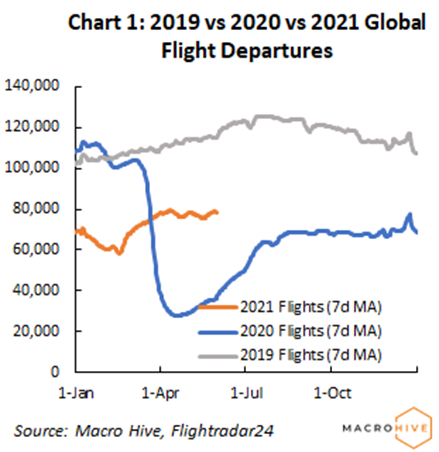
- On Sunday, there were 7,986 scheduled departures, down 2.7% WoW. Actual flights within our sample also decreased 2.3%. Globally, flight departures decreased 1.4% WoW (Chart 1).
- Across our five US airports, average actual flights decreased on last week. Flights out of New York and Chicago were down 5.3% and 19.6% WoW, respectively (Chart 3). Scheduled flights also fell, with Chicago experiencing the largest drop (Chart 2). Overall, there were 3,613 flight departures from our selected US airports. Capacity is at 69% of pre-COVID capacity (Chart 4), with Dallas remaining highest (86%).
- European flight demand increased further – planned and actual flights were up 6.6% and 6.8% WoW, respectively. Gatwick, Milan and Paris experienced the largest percentage increases (Chart 3). European airport capacity increased to 36%, with Frankfurt (47%) and Madrid (39%) highest and Gatwick (21%) lowest.
- Across Asian airports, planned flights decreased 0.4% WoW, and actual flights were up 2% WoW. Tracked flights out of Tokyo decreased most, but increased 8% in Shanghai (Charts 3). Overall capacity increased to 60% of pre-COVID levels, with Beijing highest (93%) and Singapore lowest (23%).
Information on long-term movements in flight data is available at the bottom of the page.

US
UK
Italy
Spain
Germany
France
Canada
China
Japan
Hong Kong
South Korea
Singapore