
The Best Methods For Measuring Cryptocurrency Market Liquidity

- By Sam van de Schootbrugge
- Sign-up to discuss on Slack
- 5 min read
The lack of a regulated data feed and the abundance of crypto exchanges make it hard for investors to access the high-frequency bid-ask spreads used for calculating liquidity. As a result, most traders rely on lower-frequency transaction-based data, such as daily high, low and closing prices to evaluate market quality.
A recently published paper from the Journal of Banking and Finance explores which transaction-based liquidity measures investors should use when (i) calculating the level of liquidity, and (ii) comparing liquidity across exchanges. Comparing these measures against a set of benchmark liquidity estimates based on order book data, they find the following:
The authors compare the performances of some commonly used transaction-based measures of liquidity. These are calculated from data on open, high, low and closing prices as well as the number of transactions and the dollar trading volume for each subinterval. These are the key ones:
To assess which transaction-based cryptocurrency liquidity measures work best, the authors create four benchmark measures of liquidity derived from high-frequency order book data:
The authors score their performance across three dimensions:
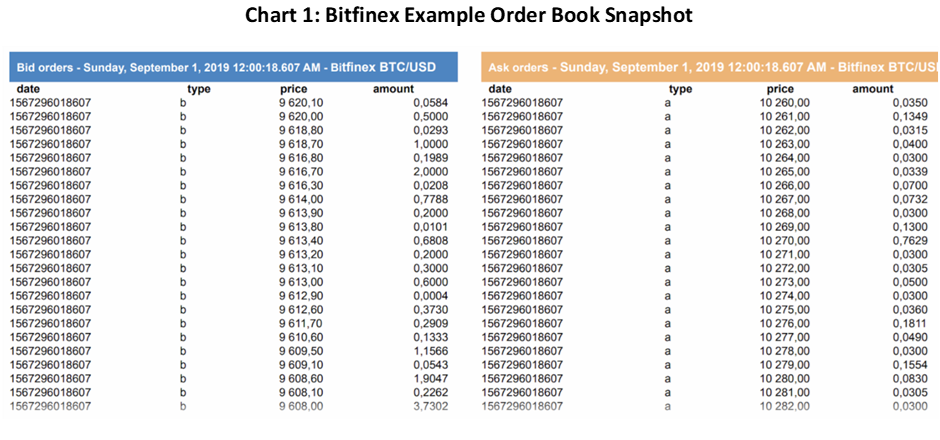
Underpinning the liquidity measures is data on bitcoin and ethereum from three exchanges – Bitfinex, Bitstamp and Coinbase Pro – compiled over a two-year period (2017-2019). All three operate an electronic central limit order book, from which the authors collect information on transactions and order book snapshots comprising the 50 best bids and asks (Chart 1).
The transaction data used for the low-frequency measures includes the price and the corresponding dollar trading volume for each transaction, a UNIX time stamp, a unique exchange-specific ID and a trade indicator which indicates whether a transaction was buyer-initiated or seller-initiated. For the main results, data is collected at one-hour frequencies to get an estimate of daily liquidity.
 Source: Kaiko
The descriptive statistics show trading activity is markedly higher for BTC/USD than for ETH/USD on all three exchanges, especially in terms of USD trading volume. Coinbase Pro is the most active exchange, but Bitfinex has the highest average daily USD volume.
On liquidity, the percentage trading costs in the cryptocurrency markets are very low. Average quoted and effective spreads on Bitfinex and Coinbase Pro are below 1bp. The price impact on these two exchanges amounts to approximately 40% of the effective spread, implying that the suppliers of liquidity earn a very small positive realised spread on average. This is not the case on Bitstamp, where liquidity suppliers appear to earn significant realised spreads.
Overall, the authors show that all three exchanges reveal strong similarities in the liquidity measures, both within and between the three exchanges. Bitstamp is, however, substantially less liquid for ETH/USD than the other two exchanges.
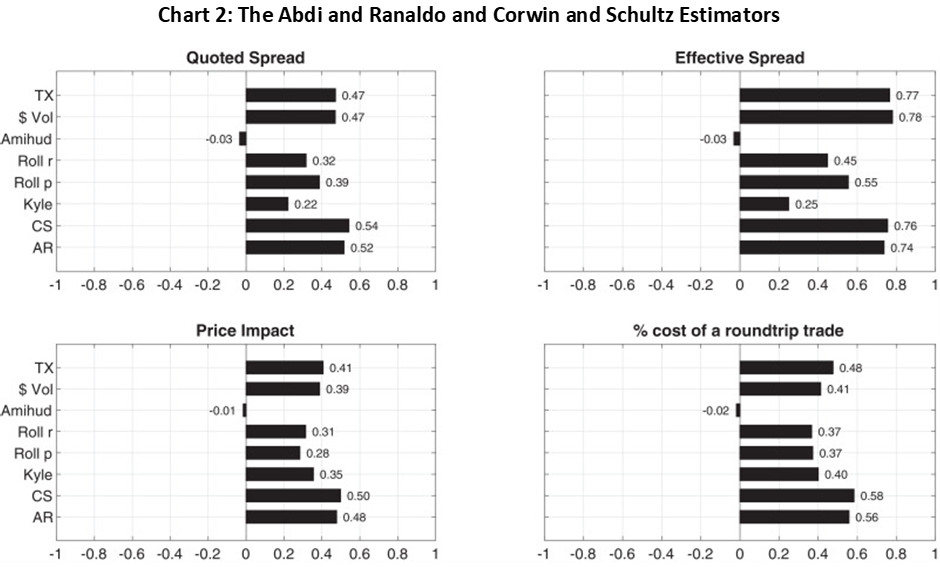
An accurate transactions-based measure should capture the time-series variation in liquidity and should therefore be positively correlated with the benchmark measures. Comparing the accuracy of the liquidity measures at a daily frequency, the Abdi and Ranaldo (2017) and Corwin and Schultz (2012) estimators perform best, especially against the effective spread (Chart 2). The effective spread is also highly correlated to the number of transactions and the dollar trading volume. This implies that higher trading activity is associated with higher execution costs.
 Source: Paper, page 24
The poor performance of the widely used Amihud (2002) measure is justified as follows: ‘The illiquidity ratio is based on the presumption that, in a less liquid market, a given dollar trading volume will have a larger impact on prices and will thus result in a larger price change’. Given that dollar trading volume is positively correlated with higher execution costs in crypto markets, the Amihud (2002) measure has broken down.
In addition to this main result, two others stand out. First, a hybrid measure consisting of all four transaction-based liquidity estimators does no better than Abdi and Ranaldo (2017) and Corwin and Schultz (2012). Second, the two best measures outperform most during periods of high volatility and high volume, and their performance does not change during periods of high and low returns.
The level of liquidity is important for trading strategies and portfolio allocations. The authors determine which of the measures can most accurately assess the level of cryptocurrency liquidity by estimating the prediction errors between the benchmarks and the transaction-based measures.
By this metric, the Amihud (2002) and Kyle and Obizhaeva (2016) measures are best at capturing the level of the effective spread. They have the lowest RMSE and MAE for all data frequencies, i.e., hourly, daily, and 15-daily. The Abdi and Ranaldo (2017) and Corwin and Schultz (2012) estimators perform poorly but improve at lower frequencies.
The paper only uses data from three crypto exchanges. Nevertheless, the authors determine which of the transaction-based measures can most accurately rank these trading venues in terms of liquidity. On this front, two general patterns emerge:
Overall, the Corwin and Schultz (2012) estimator is the most accurate measure of cross-exchange liquidity.
Investors seeking the most liquid exchanges should use the Amihud (2002) illiquidity ratio or the Kyle and Obizhaeva (2016) estimator. These measures are also good at estimating the level of execution costs (the cost of a roundtrip trade).
The Corwin and Schultz (2012) or Abdi and Ranaldo (2017) liquidity measures best serve investors hoping to time the liquidity of cryptocurrency markets and enter or exit when markets are liquid. These estimators best capture time-series variation in liquidity. The former is also good at estimating liquidity across exchanges.
Brauneis A., Mestel R., Riordan R., Theissen E., (2021), How to Measure the Liquidity of Cryptocurrency Markets?, Journal of Banking & Finance 106041, https://www.sciencedirect.com/science/article/pii/S0378426620303022
Spring sale - Prime Membership only £3 for 3 months! Get trade ideas and macro insights now
Your subscription has been successfully canceled.
Discount Applied - Your subscription has now updated with Coupon and from next payment Discount will be applied.